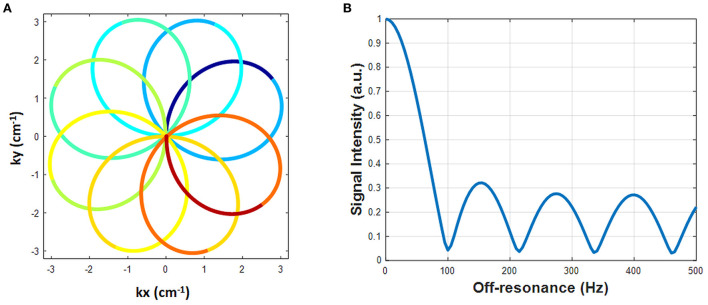
Figure 1.
The designed rosette trajectory and its spectral response. (A) The rosette trajectory used in this work, where the segments used to generate images at different echo times are indicated by different colors. (B) Spectral response of the trajectory. Fat signals at −220 Hz are suppressed to 5.3%.

