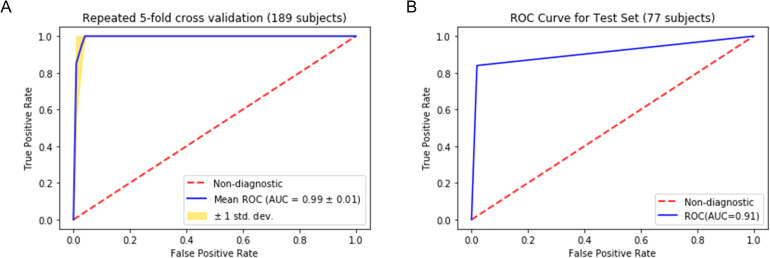
Figure 10.
Receiver operating characteristic (ROC) analysis for the predictive model. The figure shows the ROC analysis for the Random Forest model we built to distinguish a healthy pancreas from a cancerous pancreas. (A) Shows the ROC curve of repeated 5-fold cross-validation results for the training dataset, including 189 randomly selected subjects. (B) Shows the ROC curve when the model is applied to the test dataset, including the remaining 77 subjects that the model has not been seen during the training.

