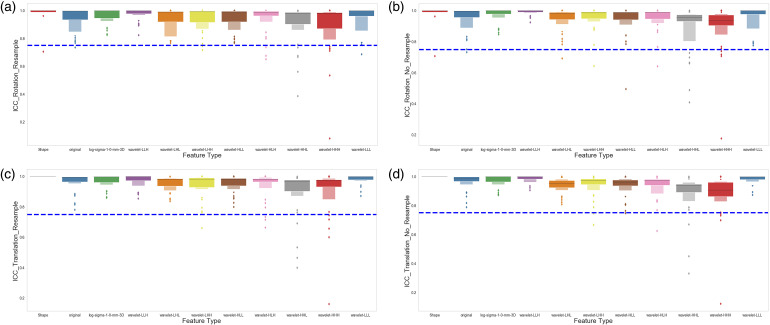
Figure 5.
Effect of image transformation (rotation and translation) on the stability of the radiomics features. (A) Shows the intraclass correlation coefficient (ICC) distribution for each group of the radiomics features after the images were rotated (−9°, −6°, −3°, 3°, 6°, 9°) and resampled to 1×1×1 mm3. (B) Shows the ICC distribution for each group of the radiomics features after the images were rotated (−9°, −6°, −3°, 3°, 6°, 9°) with the original image resolution. (C) Shows the ICC distribution for each group of the radiomics features after the images were translated, as described in the Materials and Methods section, and resampled to 1×1×1 mm3. (D) Shows the ICC distribution for each group of the radiomics features after the images were translated, as described in the Materials and Methods section, with the original image resolution.

