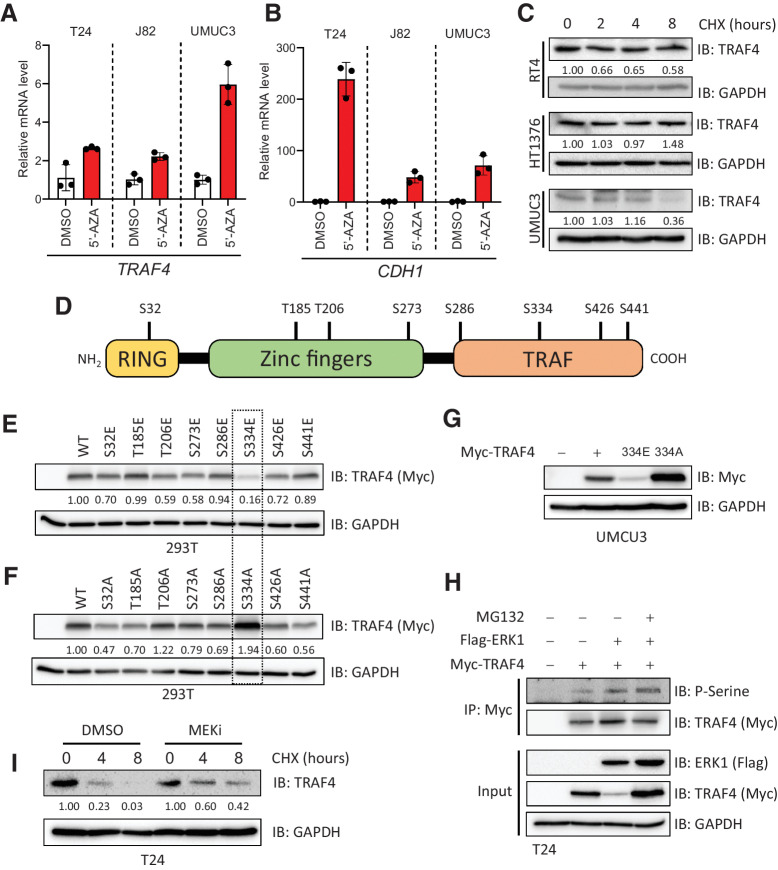
Figure 2.
TRAF4 is repressed in mesenchymal (bladder cancer) cell lines at the epigenetic and proteomic levels. A, Real-time PCR results showing changes in the TRAF4 mRNA level in mesenchymal cell lines after treatment with 5-AZA, performed in 3 technical repeats. B, Real-time PCR results showing changes in the CDH1 mRNA level in cell lines after treatment with 5-AZA; the error bars indicate ± SD, performed in 3 technical repeats. C, Immunoblot results showing the endogenous TRAF4 levels in the indicated cell lines after treatment with cycloheximide (CHX). GAPDH, loading control. The numbers indicate the relative quantitative TRAF4 levels with respect to the loading control GAPDH, n = 1 D, Schematic representation of TRAF4 showing the distinct domain structures and the candidate phosphorylated serine and threonine residues that were identified using mass spectrometric analysis. E, Immunoblot results from 293T cells transfected with expression constructs for either TRAF4 or the TRAF4 glutamic acid (E) mutant. GAPDH, loading control. The numbers indicate the relative quantitative TRAF4 levels with respect to the loading control GAPDH. F, Immunoblot results from 293T cells transfected with expression constructs for either TRAF4 or the TRAF4 alanine (A) mutant. GAPDH, loading control. The numbers indicate the relative quantitative TRAF4 levels with respect to the loading control GAPDH. G, Western blot analysis of ectopic Myc-TRAF4 WT and the S334E and S334A mutants in the UMUC3 cell line. GAPDH, loading control. H, Immunoprecipitation of Myc-TRAF4 with or without Flag-ERK1 overexpression, GAPDH, loading control. I, Western blot analysis of TRAF4 expression in T24 cells treated with CHX at the indicated times, in the presence of DMSO (control) or MEKi. GAPDH, loading control. The numbers indicate the relative quantitative TRAF4 levels for both DMSO and MEKi (PD0325901) treatment separately, with respect to the loading control GAPDH.

