. 2022 Jun 22;20(10):1516–1531. doi: 10.1158/1541-7786.MCR-20-1029

Figure 6.

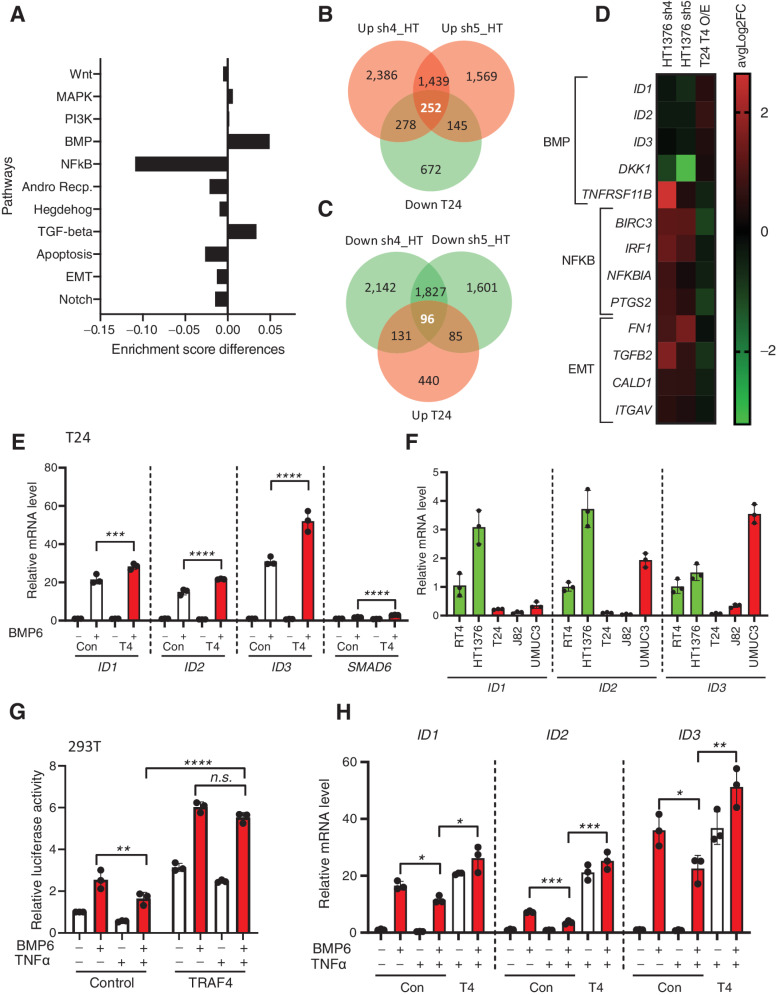
Figure 6. Dysregulated expression of TRAF4 in bladder cancer cell lines affects BMP/SMAD- and NF-κb-responsive genes. A, Graph showing differences in enrichment scores when TRAF4 was overexpressed in T24 cells. Gene signatures of eleven major cancer-associated signaling pathways were considered for analysis. B, Venn diagram showing the numbers of genes that were upregulated in HT1376 cells transfected with two independent shRNAs targeting TRAF4 (pink) and downregulated in T24 cells with stable overexpression of TRAF4 (green) compared with the corresponding control cells. The 252 genes in the middle are the reciprocally affected common genes. The results were obtained from four independent replicates for each sample (n = 4). C, Venn diagram showing the numbers of genes that were downregulated in HT1376 cells transfected with two independent shRNAs targeting TRAF4 (green) and upregulated in T24 cells with stable overexpression of TRAF4 (pink) compared with the corresponding control cells. The 96 genes in the middle represent the reciprocally affected common genes. The results were obtained from four independent replicates for each sample (n = 4). D, Heatmap showing the common dysregulated genes in the BMP, NF-κB and EMT gene signatures in both cell lines. E, Real-time PCR results showing the mRNA expression levels of the indicated genes in control (empty vector with a Myc tag) vs. TRAF4-overexpressing T24 cells upon stimulation with BMP6 (50 ng/mL) for 1 hour. The error bars indicate ± SD, performed in 3 technical repeats. F, Real-time PCR results showing the mRNA expression levels of ID1, ID2, and ID3 in the indicated cell lines, performed in 3 technical repeats. G, A luciferase reporter assay was conducted in 293T cells transfected with the BRE-luciferase reporter, SV40 Renilla and either empty vector control or TRAF4. Transfected cells were stimulated overnight with BMP6 (50 ng/mL) and/or TNFα (10 ng/mL) where indicated. The error bars indicate ± SD; **, P ≤ 0.01 and ****, P ≤ 0.0001 calculated using two-way ANOVA; n.s. indicates a nonsignificant P value. Representative results from three independent experiments are shown (n = 3). H, Real-time PCR results showing the mRNA expression levels of the indicated genes in control (empty vector with a Myc tag) vs. TRAF4-overexpressing T24 cells upon stimulation with BMP6 (50 ng/mL) and/or TNFα (10 ng/mL) as indicated for 1 hour. The error bars indicate ± SD, performed in 3 technical repeats.

Dysregulated expression of TRAF4 in bladder cancer cell lines affects BMP/SMAD- and NF-κb-responsive genes. A, Graph showing differences in enrichment scores when TRAF4 was overexpressed in T24 cells. Gene signatures of eleven major cancer-associated signaling pathways were considered for analysis. B, Venn diagram showing the numbers of genes that were upregulated in HT1376 cells transfected with two independent shRNAs targeting TRAF4 (pink) and downregulated in T24 cells with stable overexpression of TRAF4 (green) compared with the corresponding control cells. The 252 genes in the middle are the reciprocally affected common genes. The results were obtained from four independent replicates for each sample (n = 4). C, Venn diagram showing the numbers of genes that were downregulated in HT1376 cells transfected with two independent shRNAs targeting TRAF4 (green) and upregulated in T24 cells with stable overexpression of TRAF4 (pink) compared with the corresponding control cells. The 96 genes in the middle represent the reciprocally affected common genes. The results were obtained from four independent replicates for each sample (n = 4). D, Heatmap showing the common dysregulated genes in the BMP,NF-κB and EMT gene signatures in both cell lines. E, Real-time PCR results showing the mRNA expression levels of the indicated genes in control (empty vector with a Myc tag) vs. TRAF4-overexpressing T24 cells upon stimulation with BMP6 (50 ng/mL) for 1 hour. The error bars indicate ± SD, performed in 3 technical repeats. F, Real-time PCR results showing the mRNA expression levels of ID1, ID2, and ID3 in the indicated cell lines, performed in 3 technical repeats. G, A luciferase reporter assay was conducted in 293T cells transfected with the BRE-luciferase reporter, SV40 Renilla and either empty vector control or TRAF4. Transfected cells were stimulated overnight with BMP6 (50 ng/mL) and/or TNFα (10 ng/mL) where indicated. The error bars indicate ± SD; **, P ≤ 0.01 and ****, P ≤ 0.0001 calculated using two-way ANOVA; n.s. indicates a nonsignificant P value. Representative results from three independent experiments are shown (n = 3). H, Real-time PCR results showing the mRNA expression levels of the indicated genes in control (empty vector with a Myc tag) vs. TRAF4-overexpressing T24 cells upon stimulation with BMP6 (50 ng/mL) and/or TNFα (10 ng/mL) as indicated for 1 hour. The error bars indicate ± SD, performed in 3 technical repeats.