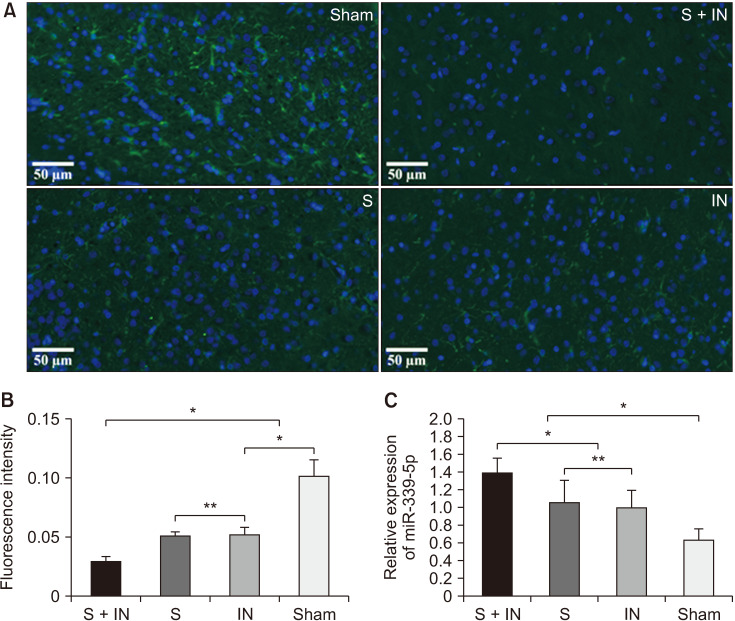
Fig. 5.
(A, B) Immunofluoresence assays indicate that the expression of MOR is significantly down-regulated in group S + IN (*P < 0.050). Under the laser-scanning confocal microscope the MOR appeared with a green fluorescence (magnification: 400×). (C) The results of qRT-PCR show that the expression of miR-339-5p is significantly up-regulated in group S + IN (*P < 0.050). There were no significant differences between group IN and group S (**P > 0.050). The error bars indicate mean ± standard deviation. MOR: mu-opioid receptors, S: stress, IN: incision, qRT-PCR: quantitative real-time polymerase chain reaction.

