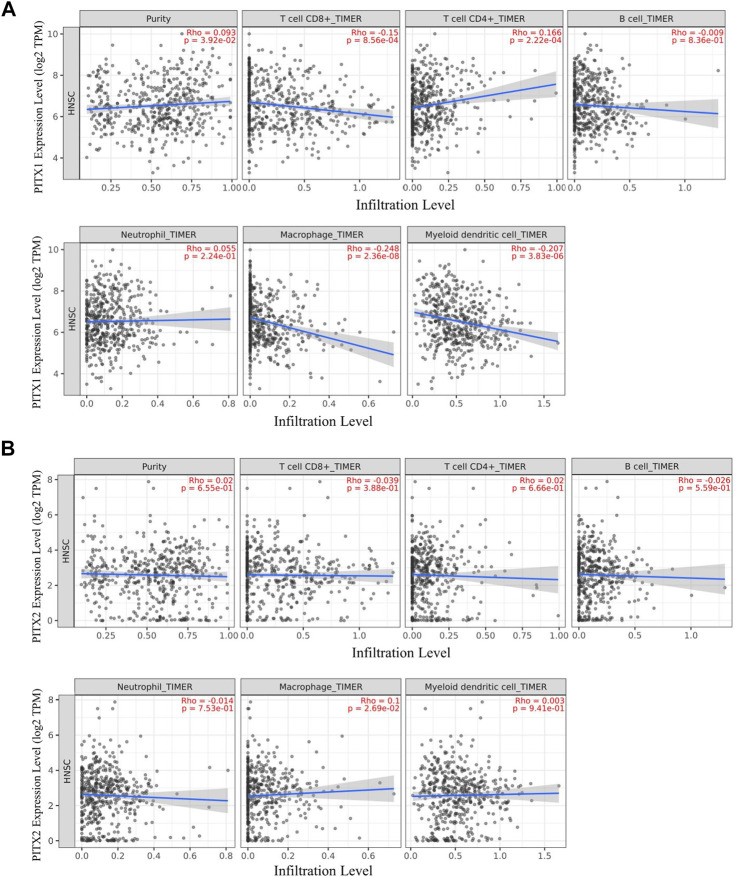
FIGURE 7.
TIMER analysis of correlations between PITX1 and PITX2 expression and immune cell infiltration in HNSC. (A) Correlations between PITX1 expression and immune cell infiltration were evaluated using TIMER. (B) Correlation between PITX2 expression and immune cell infiltration levels using TIMER.

