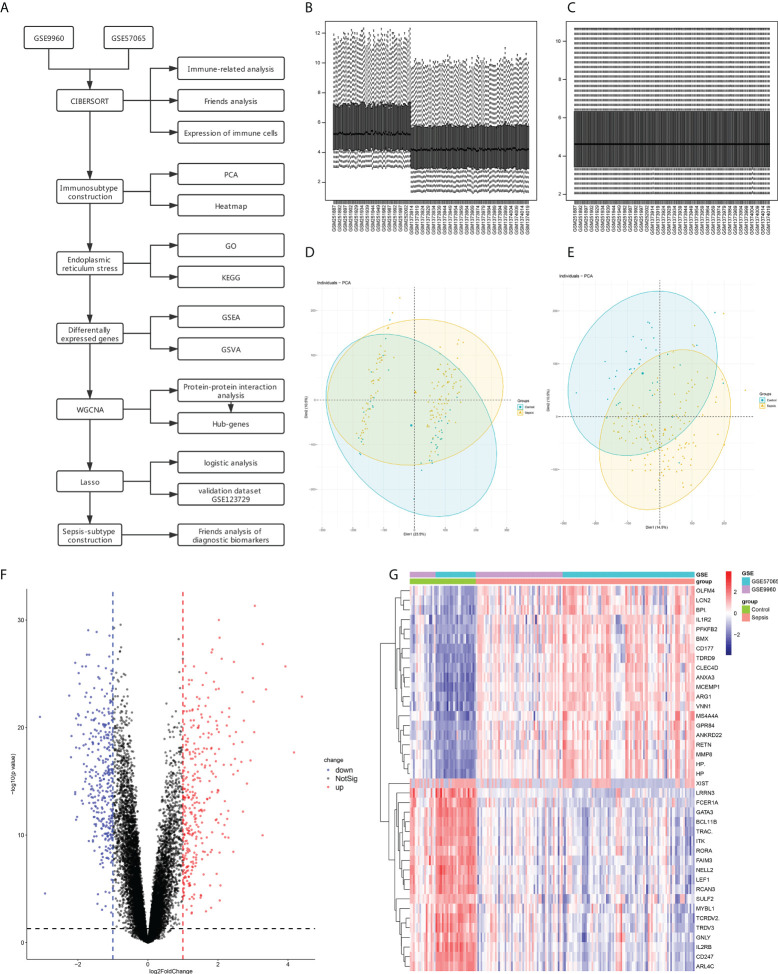
Figure 1.
Data Preprocessing and identification of differentially expressed genes (DEGs). (A) Flow chart for gene set analyses. (B) Box line diagram of the merged dataset before correction. (C) Box line diagram of the combined dataset after correction. (D) PCA for sepsis and healthy control samples before batch correction with ComBat. (E) PCA for sepsis and healthy control samples after batch correction with ComBat. (F) Volcano plot showing DEGs between sepsis and control samples. (G) Heatmap showing the top 20 up- and down-regulated genes.

