Figure 3.
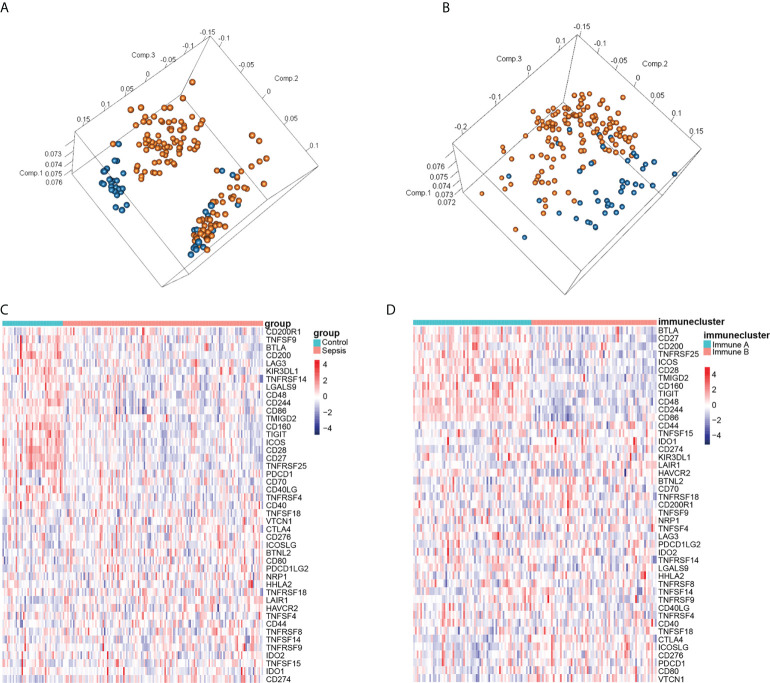
Identification of immune subtypes in sepsis. (A) PCA according to the subgroups of sepsis and healthy control samples. (B) PCA according to immunophenotyping. (C) Heatmap of immune infiltration-related genes in the normal and septic groups. (D) Heatmap of immune infiltration-related genes according to immunophenotyping. Red and blue squares indicate activation and suppression, respectively.

