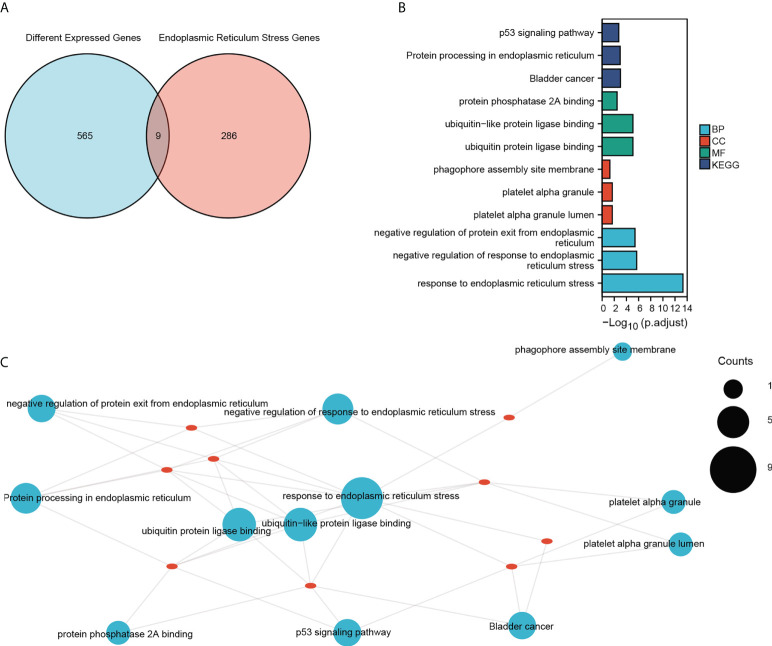
Figure 4.
GO and KEGG enrichment analysis. (A) Venn diagram showing the intersection of DEGs and ER stress-related genes in the combined dataset. (B) GO functional enrichment analysis of the intersecting genes with the top three of BP, CC and MF terms and KEGG pathways. The horizontal coordinate shows -log(p.adjust) values and the vertical coordinate shows GO terms. (C) The enrichment results are displayed on the network, and the node size represents the number of genes enriched. The red dots represent the nine genes that were enriched.

