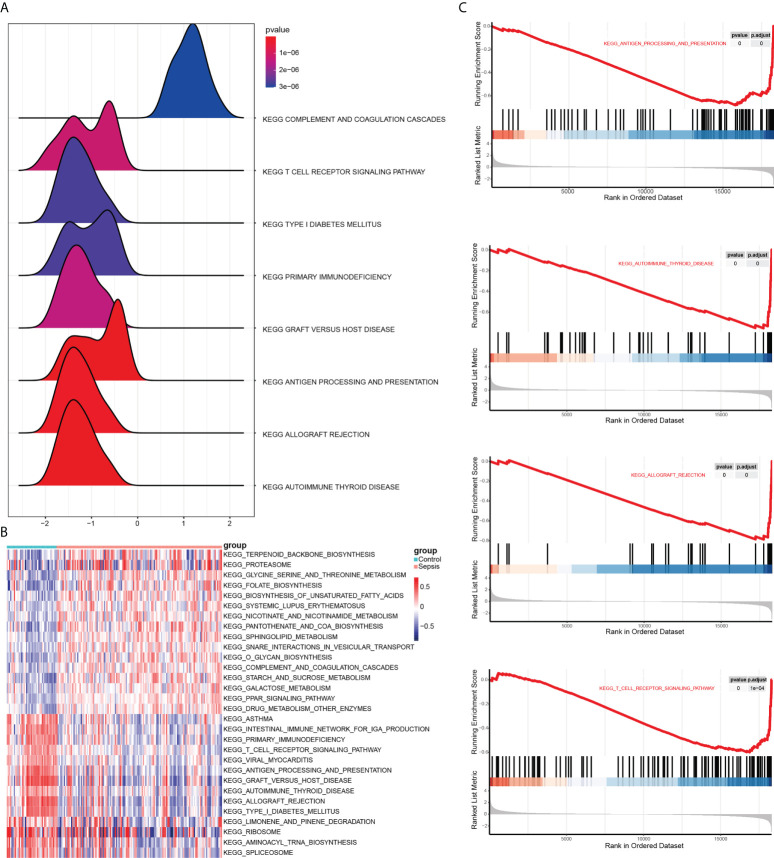
Figure 5.
Results of GSEA and GSVA. (A) Mountain range plot showing the GSEA results of the merged dataset. Horizontal coordinate shows the gene ratio, vertical coordinate show the KEGG pathways, and the color indicates P-value. (B) Heat map showing the results of GSVA on GSEA enrichment data. Red and blue indicate activation and suppression, respectively. (C) The top 5 items of the GSEA.

