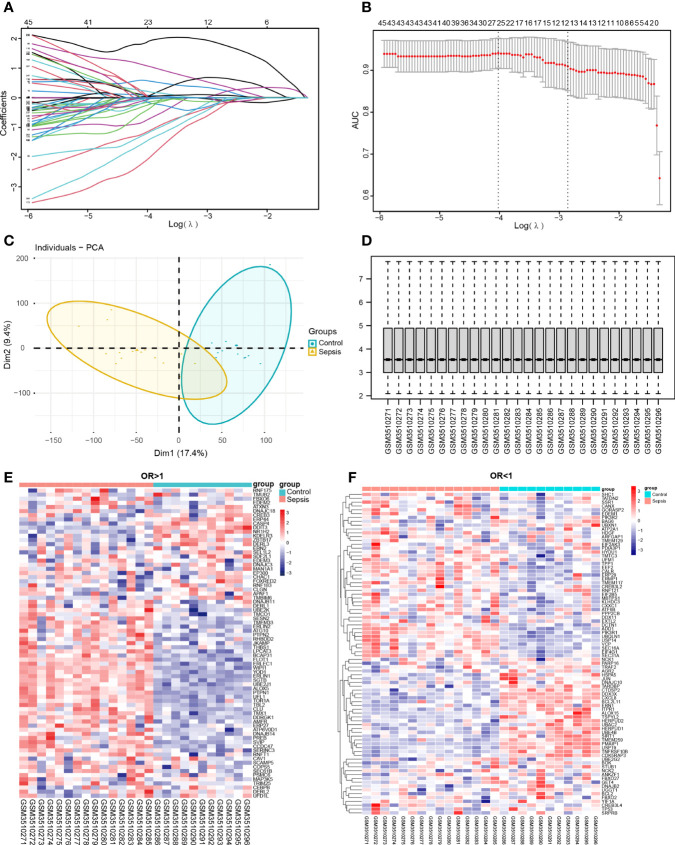
Figure 8.
Screening for diagnostic markers. (A, B) Lasso analysis of the combined dataset. (C, D) PCA plot and box plot of the validation set GSE123729 data after correction. (E, F) Heat map showing differential expression of diagnostic markers in the validation set obtained by one-way logistic regression analysis. Red indicates up-regulation, blue indicates down-regulation, and darker colors indicate a larger fold change.

