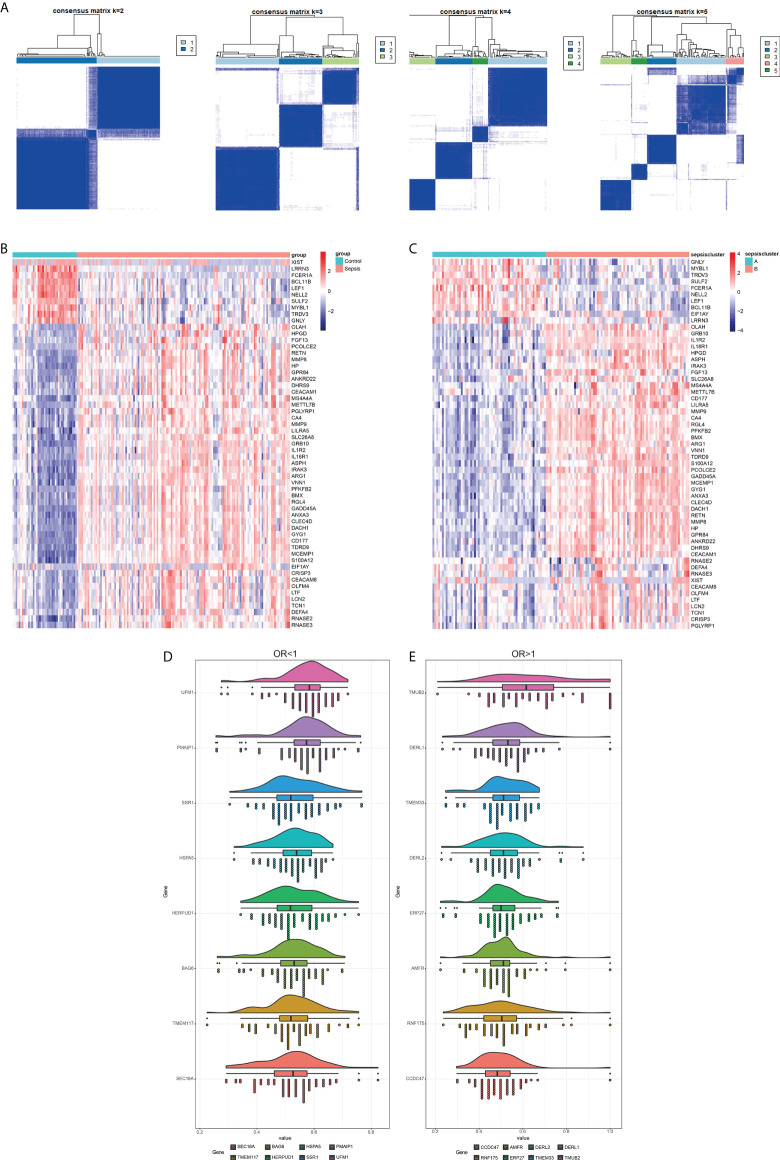
Figure 9.
Identification of sepsis subtypes and diagnostic markers. (A) The number of genotype clusters in the sepsis dataset. (B) Heat map of diagnostic genes based on control and sepsis groups. (C) Heat map of diagnostic genes based on sepsis subtype. Red indicates activation and blue indicates inhibition. (D) Diagnostic markers with OR less than 1. (E) Diagnostic markers with OR more significant than 1.

