. 2022 Aug 24;4(5):e220061. doi: 10.1148/ryai.220061

Figure 5:

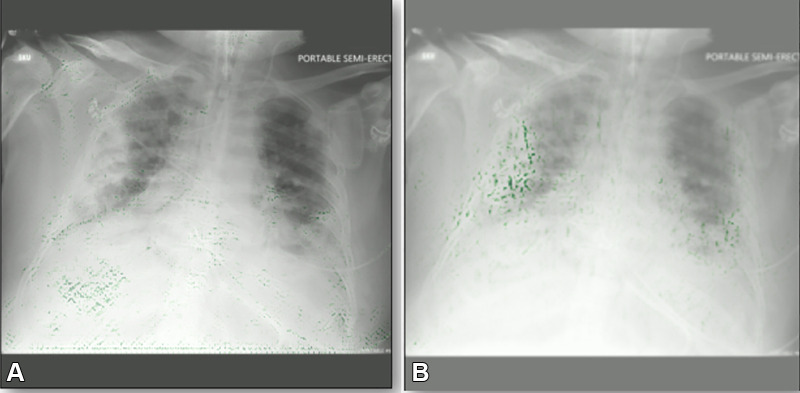
Example gradient-weighted class activation mapping images for two COVID-19 detection models. Both models have the same level of accuracy on the same test data. (A) Image shows a biased model localizing the incorrect part of the chest radiograph as the opacity. (B) Image shows a properly trained model localizing the correct part of the chest radiograph. Green dots represent localization.

Example gradient-weighted class activation mapping images for two COVID-19 detection models. Both models have the same level of accuracy on the same test data. (A) Image shows a biased model localizing the incorrect part of the chest radiograph as the opacity. (B) Image shows a properly trained model localizing the correct part of the chest radiograph. Green dots represent localization.