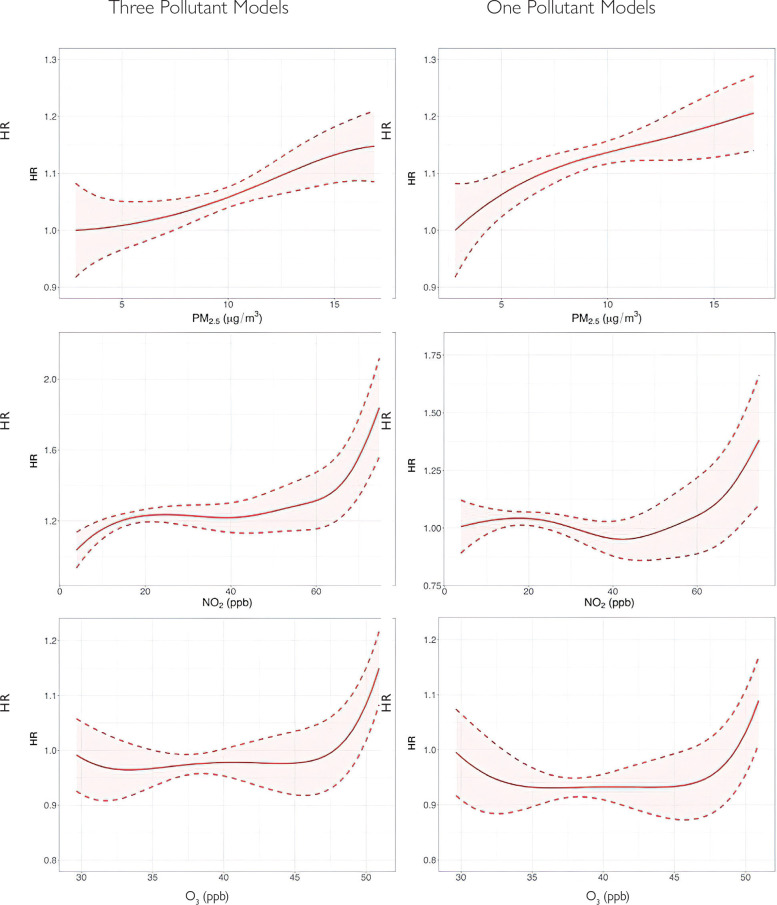
Commentary Figure 2.
Estimated ER functions relating PM2.5, NO2, and O3 to all-cause mortality among Medicare enrollees (2000–2016) with and without adjustment for copollutants. Data shown are HRs with 95% CIs obtained using a generalized propensity score matching approach. The left panels show the ER functions associating long-term exposure to one pollutant with all-cause mortality, adjusted for the other two pollutants as potential confounders. The right panels show the ER functions for single-pollutant models without adjusting for the other two pollutants. To avoid potentially unstable behavior at the support boundaries, the highest 1% and lowest 1% of pollutants exposures were excluded. (Source: Figure 7 in the Investigators’ Report.)

