TABLE 2.
Deletion analysis of the araABDLMNPQ-abfA operon promoter
| Promoter fusiona (Plasmid/strain) | Constructb | β-Galactosidase activity (Miller units)c
|
Repression factord | |
|---|---|---|---|---|
| −l-Arabinose | +l-Arabinose | |||
| araA′-lacZ |  |
|||
| pLM32/IQB300 | 40.4 ± 0.4 | 1,806.6 ± 73.3 | 44.2 ± 1.8 | |
| pLM32/IQB327 (AraR−) | 3,233.7 ± 159.2 | 2,224.3 ± 150.0 | 0.7 ± 0.1 | |
| pLM33/IQB301 | 6.7 ± 0.2 | 312.7 ± 11.0 | 46.9 ± 2.4 | |
| pLS13/IQB304 | 39.0 ± 2.1 | 1,582.9 ± 73.3 | 40.6 ± 2.9 | |
| pLM34/IQB302 | 484.7 ± 23.1 | 608.1 ± 20.2 | 1.2 ± 0.1 | |
| pLM35/IQB303 | 936.0 ± 35.8 | 839.9 ± 18.0 | 0.9 ± 0.0 | |
Plasmids containing different araA′-lacZ promoter fusions were integrated at the amyE locus of the B. subtilis 168T+ wild-type or B. subtillis IQB215 (AraR−) chromosome (see Materials and Methods).
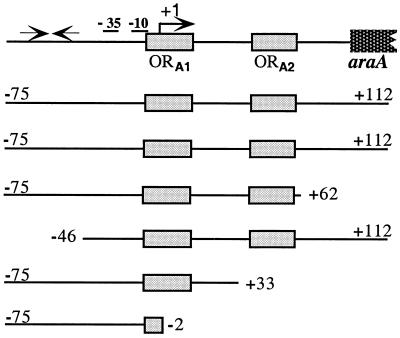
The promoter region of the araABDLMNPQ-abfA operon is depicted and drawn to scale. The −10 and −35 regions and transcriptional start point (+1) of the araA gene are indicated. The AraR binding sites identified in vitro (ORA1 and ORA2 [25]) are represented by gray boxes. The two convergent black arrows represent a putative hairpin loop structure previously identified by sequence analysis (41). Below the scheme the sizes of the various araA promoters are indicated. The start and end of each DNA fragment is labeled relative to the transcriptional start site.
The strains containing the various truncated araA promoters were grown on C minimal medium supplemented with casein hydrolysate 1% (wt/vol) in the absence or presence of 0.4% (wt/vol) l-arabinose. The levels of accumulated β-galactosidase activity were measured 2 h after induction.
AraR repression was calculated as the ratio between the level of expression (Miller units) obtained in the presence of l-arabinose, and the value was determined in the absence of inducer.
