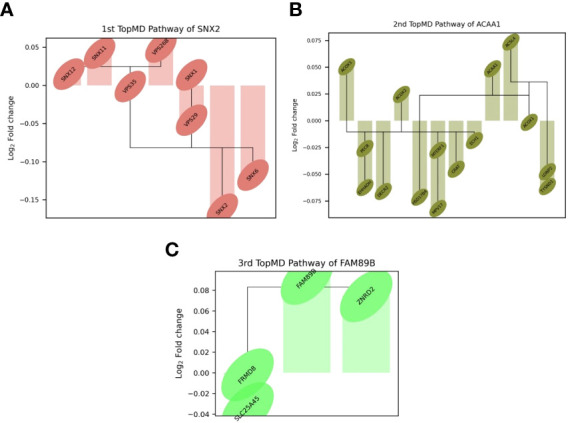
Figure 3.

Differential expression of top genes in the top 3 pathways between patients admitted to ICU and not admitted to ICU of the training set. Connections represent known gene interactions according to STRING-db. (A) SNX2 - controlling epidermal growth factor receptor (EGFR) presentation, (B) ACAA1-peak pathway, representing peroxisome proliferator-activated receptor alpha (PPAR-α) signalling, (C) FAM89B-peak pathway, mediating transforming growth factor beta (TGF-β) signalling. Pathways and genes identified by topological data analysis, TopMD.
