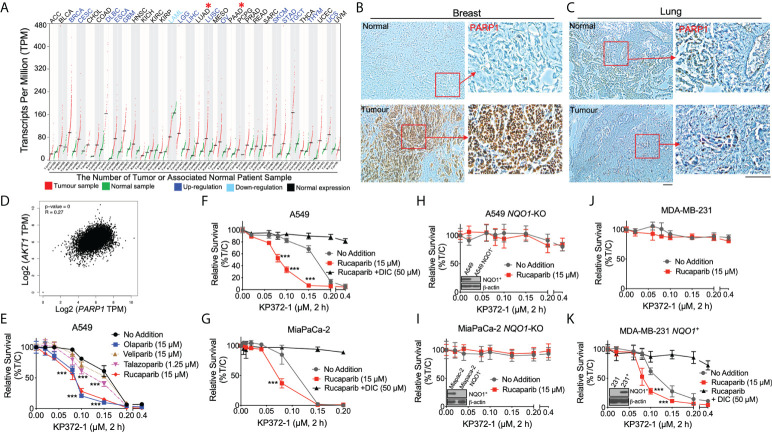
Figure 1.
KP372-1 enhances the lethality of PARP inhibitors in various cancer cells and depends on NQO1 activity. (A) PARP1 mRNA expression in matched pan-cancer tumor tissue. Data were from TCGA and analyzed with GEPIA web server. Red color indicates tumor sample; green indicates associated normal patient sample; blue color suggests up-regulation of PARP1; light blue indicates down-regulation of PARP1; black indicates normal expression of PARP1. "*" (in red color) shows the representative cancer types we are focused of this article, which have normal PARP1 expression. (B, C) Representative IHC staining of PARP1 in breast (B) and lung (C) cancer patient samples or associated normal tissues. (D) Correlation between AKT1 and PARP1 in patient data obtained from TCGA. (E) Cell viability of combination treatment of KP372-1 with various PARP inhibitors in NSCLC A549 cells. (F, G) Cell viability of combination treatment of KP372-1 with rucaparib ± DIC in NSCLC A549 (F) and pancreatic cancer MiaPaCa-2 cells (G). (H, I) Cell viability of combination treatment of KP372-1 ± rucaparib in NQO1-knockout A549 (H) and MiaPaCa-2 (I) cell lines. (J, K) Cell viability of combination treatment of KP372-1 ± rucaparib in MDA-MB-231 (J) and stable NQO1 expressing MDA-MB-231 (K) cell lines. (E–K) Cells were pre-treated ± rucaparib or other PARP inhibitors for 2 h, then exposed to KP372-1 ± rucaparib or other PARP inhibitors for 2 h, followed by washing and replacing fresh media, Cell viability was determined by DNA assay 7 days later. Data are shown as mean ± SD, each experiment was done three independent times. Scale bar indicates 110 μm. (E–G) ***P < 0.001, comparing each data point with KP372-1 treatments (t tests).

