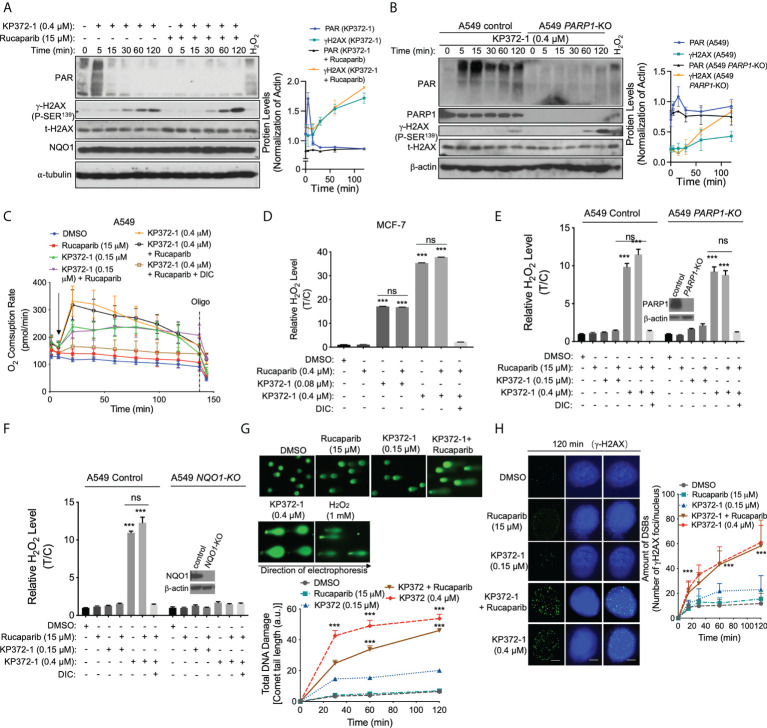
Figure 2.
PARP Inhibition blocks KP372-1-induced PARP1 hyperactivation and amplifies DNA damage. (A) A549 cells were pre-treated ± rucaparib (15 µM, 2 h), then exposed to supra-lethal dose of KP372-1 (0.4 µM) ± rucaparib for indicated times, then PAR, γH2AX and NQO1 expression alterations were assessed and quantified. (B) A549 PARP1 knockout cells were exposed to ± KP372-1 (0.4 µM) for 5 -120 min, western blot analysis of PAR and γH2AX formation at indicated time points. (C) A549 cells were pre-treated ± rucaparib (15 µM, 2 h), then exposed to KP372-1 (0.2 or 0.4 µM) ± rucaparib (added at t = 20 min, arrow), and real-time oxygen consumption rates (OCRs) were assessed by Seahorse XF analyses. Oligo, oligomycin. (D) MCF-7 cells were pre-treated ± rucaparib (0.4 μM, 2 h), then exposed to KP372-1 (0.08 or 0.4 µM) ± rucaparib for 2 h, relative H2O2 levels were assessed. (E, F) cells were pre-treated ± rucaparib (2 h), then exposed to rucaparib ± KP372-1 for 2 h, relative H2O2 levels were assessed in A549 PARP1-KO (E) and NQO1-KO (F) cells, (G, H) A549 cells were pre-treated ± rucaparib (2 h), then exposed to rucaparib ± KP372-1, cells were collected at indicated time points and assessed for: (G) Comet tail-lengths determined by alkaline comet assays; (H) DNA double strand breaks (DSBs) indicated by γH2AX with immunofluorescence staining. All error bars are means ± SD from three independent experiments. Scale bar indicates 10 µm. (D–F) ***P < 0.001 and ns: no significant, comparing each group or each data point with control (DMSO) treatments (t tests).

