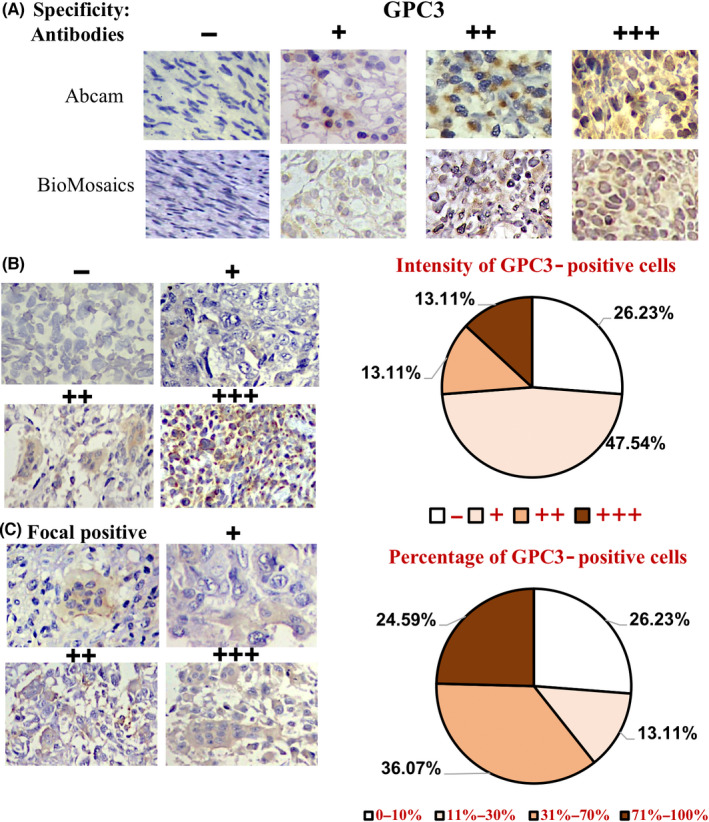
FIGURE 2.

Immunohistochemical profiling of intertumoral and intratumoral GPC3 expression patterns of OS specimens. (A) The specificity results of GPC3 immunohistochemical staining (×20) ascertained using two anti‐GPC3 antibodies from Abcam and BioMosaics. (B) The grades of GPC3 immunohistochemical labeling (×20) were scored as −, negative; +, weakly positive; ++, moderately positive; and +++, strongly positive, according to the staining intensities (left). (C) Classification of intertumoral GPC3 immunohistochemical labeling (×20) according to the percentage of GPC3‐positive tumor cells: –, all negative; +, focal positive; ++, partially positive; and +++, generally positive (left). IHC data were collected from 61 OS specimens
