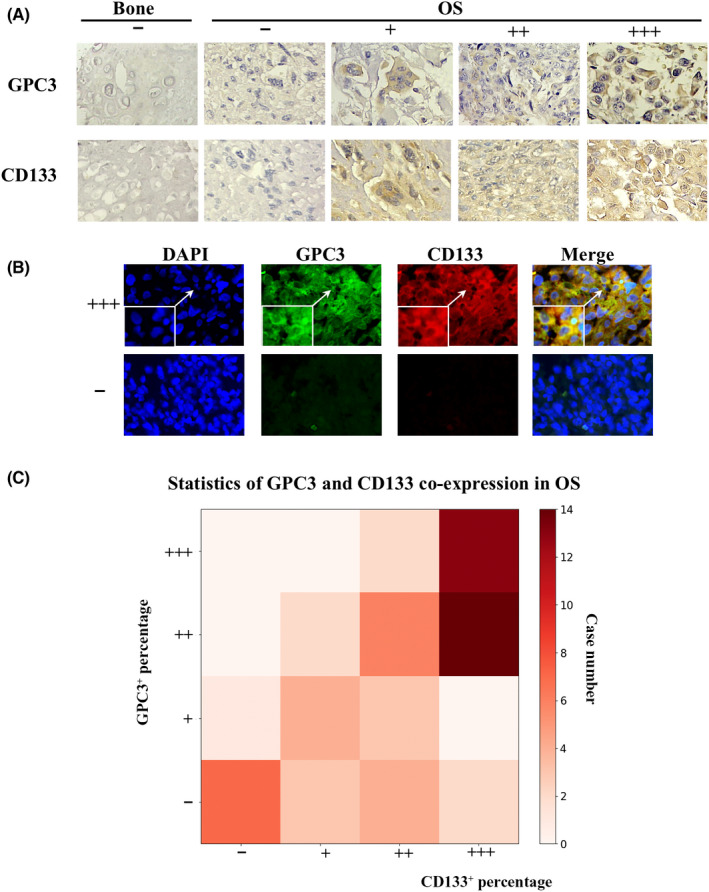
FIGURE 3.

Correlation analyses of GPC3 and CD133 expression in OS tissues and organoids. (A) Immunohistochemical demonstration of frequent GPC3 and CD133 co‐expression in OS tissues (×20). (B) GPC3 and CD133 double immunofluorescent staining (×20) of GPC3: +++, generally positive; and −, negative OS tissues. Insets represent images with higher magnification (×40). (C) Percentages of GPC3‐ and CD133‐positive OS cases and their statistical relevance (data from SPSS statistical analysis)
