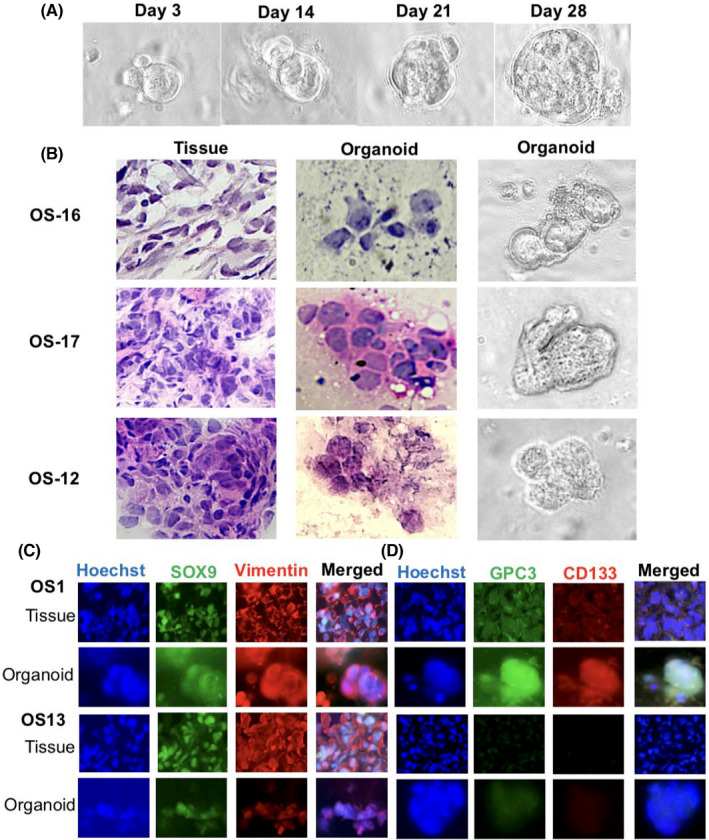
FIGURE 4.

Establishment and characterization of OS organoids. (A) Bright‐field demonstration of continuous growth of an OS‐1 organoid (×40). (B) H&E morphological staining was performed on OS tissues from three cases and the corresponding organoids and bright‐field images of the organoids of the matched patients with OS. Tissue, ×20; organoid, ×40. (C) Double immunofluorescent labeling of OS‐specific biomarkers, SOX9 and vimentin, on OS tissues and organoids with (OS‐1) and without (OS‐13) GPC3 expression. Tissue, ×20; organoid, ×40. (D) GPC3 and CD133 double immunofluorescent labeling of paired OS tissue and organoids of OS‐1 and OS‐13. Tissue, ×20; organoid, ×40
