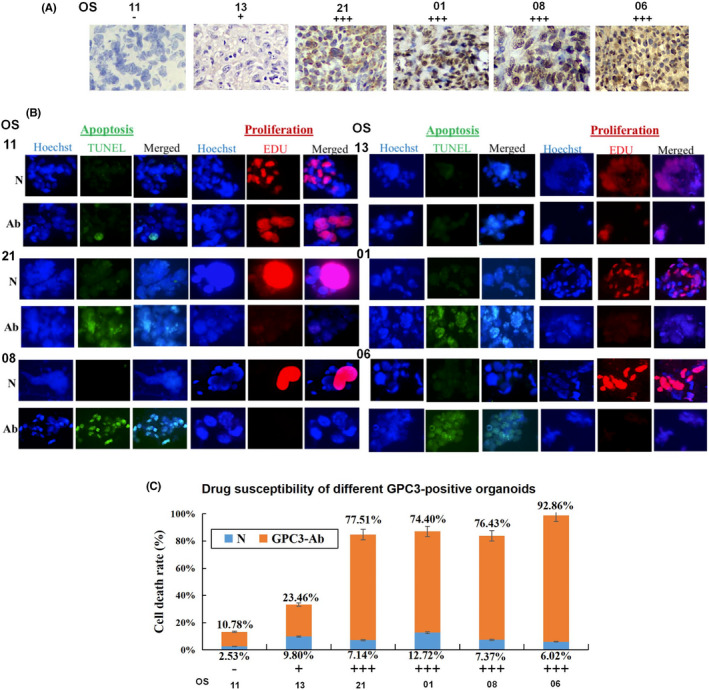
FIGURE 5.

GPC3 targeted therapy performed on OS organoids with different GPC3 expression patterns. (A) Immunohistochemical (×20) demonstration of differential GPC3 expression in OS tissues used for organoid culture. (B) Evaluation of apoptosis (TUNEL) and proliferation (EdU) of GPC3‐antibody (GPC3‐Ab)‐treated OS organoids with different levels of GPC3 expression (×40). (C) The response of OS organoids to GPC3‐Ab treatment in a GPC3‐related manner
