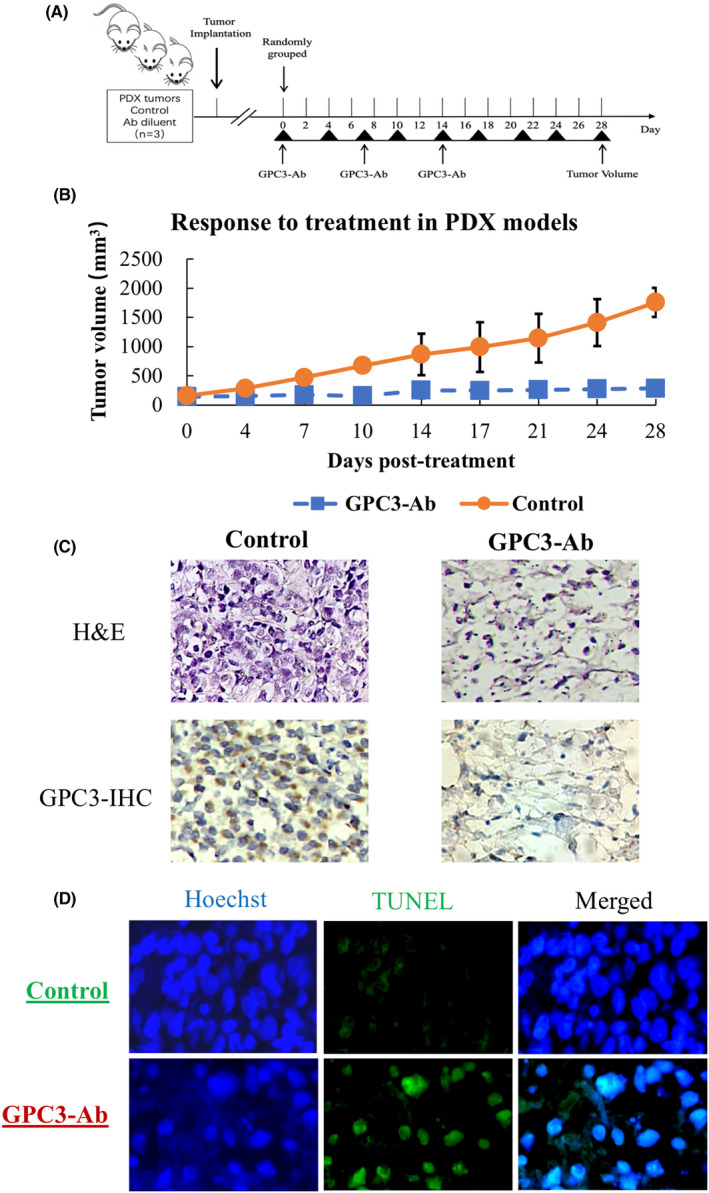
FIGURE 6.

GPC3 targeted therapy performed on a high GPC3 expression OSDX. (A) Schematic of in vivo GPC3‐Ab treatment used on the OSDX platform. (B) Tumor volume over time in a high GPC3 expression OSDX mouse model administered three times weekly with the control (antibody diluent) or GPC3‐Ab (100 μg/mouse). Data points represent mean (n = 5) ± standard error. (C) Images (×20) of H&E‐ and GPC3‐oriented immunohistochemical staining of OSDX tissues with and without (control) GPC3‐Ab treatment (GPC3‐Ab). (D) TUNEL apoptotic cell labeling (×20) of OSDX tissues without (control) or with GPC3‐Ab treatment (GPC3‐Ab)
