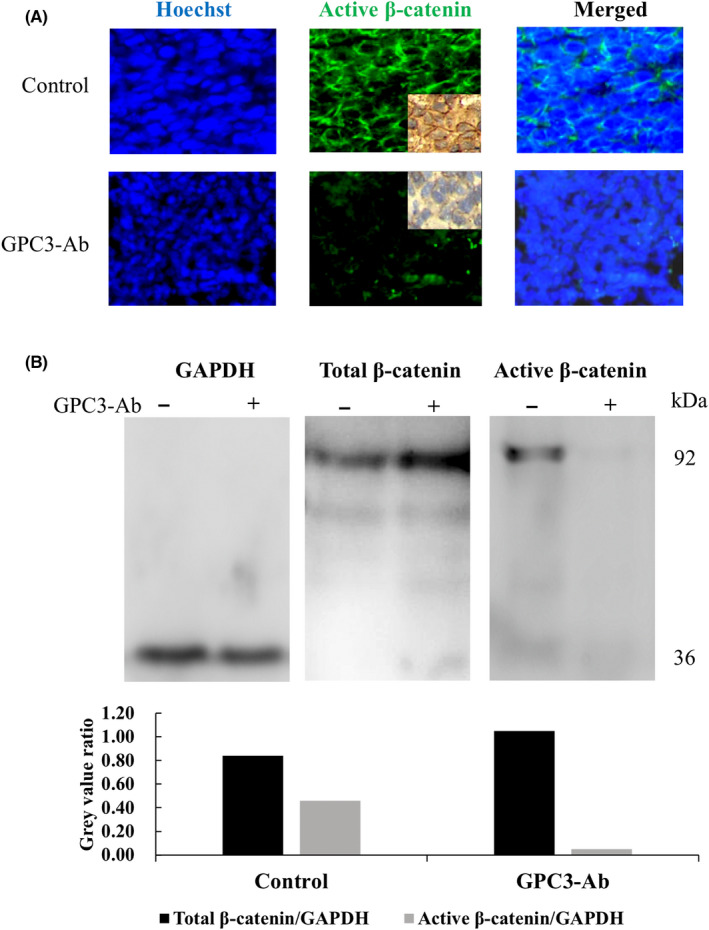
FIGURE 7.

Reduced active β‐catenin production and membranous localization in GPC3‐Ab‐treated OSDX tissues. (A) Immunofluorescence and immunohistochemical (insets) illustration of active β‐catenin in OSDX tissues with and without (control) GPC3‐Ab treatment (×20). (B) Western blot analysis of the total and active β‐catenin levels in OSDX tissues with and without GPC3‐Ab treatment. GAPDH was used as a quantitative control for analysis (gray)
