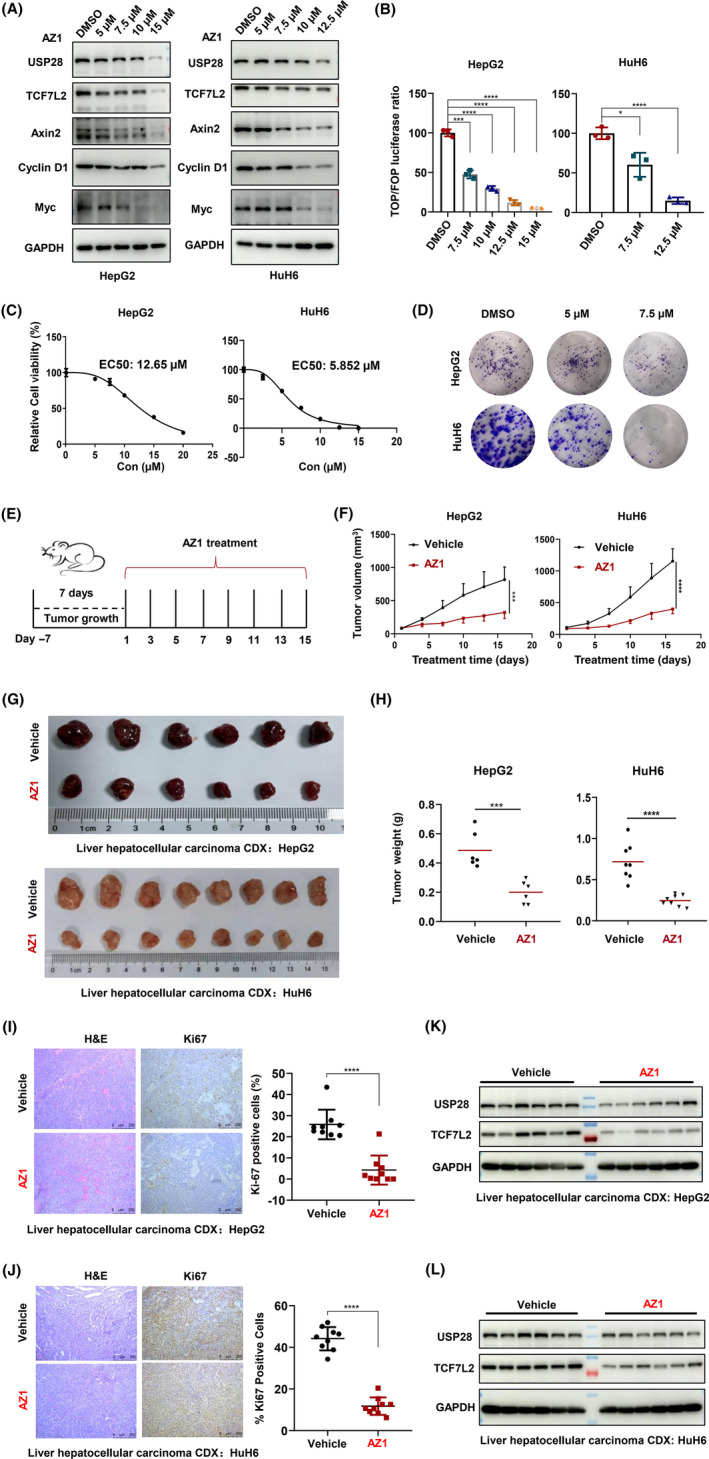
FIGURE 6.

Pharmacological inhibition of ubiquitin‐specific protease 28 (USP28) regulates transcription factor 7‐like 2 (TCF7L2) stability and exerts antiproliferative effect against liver cancer cells. (A) Western blot analysis of USP28, TCF7L2, Axin2, Cyclin D1, and Myc in HepG2 and HuH6 cells treated with different concentrations of AZ1 for 48 h. (B) TOPFlash reporter assay in HepG2 and HuH6 cells treated with AZ1 in different concentrations for 48 h. Results are expressed as relative (TOP/Renilla)/(FOP/Renilla) luciferase activity. All data are representative of three independent experiments (mean ± SEM). (C) Cell viability of HepG2 and HuH6 cells treated with AZ1 in different concentrations for 72 h determined using MTS assay. Absorbance was 490 nm. (D) Ability for plate clone formation of HepG2 and HuH6 cells treated with AZ1 in different concentrations. The above data are representative of three independent experiments (mean ± SEM). (E) Schematic diagram of the animal experimental design. (F) Tumor volume was measured every 2 days beginning on the first day of treatment. CDX from HepG2 cells, n (vehicle) = 6, n (AZ1) = 6. CDX from HuH6 cells, n (vehicle) = 8, n (AZ1) = 8. (G) Representative figure of tumors formed. (H) Tumor weight of the vehicle and AZ1 groups. CDX from HepG2 cells, n (vehicle) = 6, n (AZ1) = 6. CDX from HuH6 cells, n (vehicle) = 8, n (AZ1) = 8. (I, J) H&E and immunohistochemical staining of Ki‐67 after treatment with vehicle or AZ1 for tumor tissues of CDX from HepG2 (I) and HuH6 cells (J) (bar = 50 μm). n (vehicle) = 9, n (AZ1) = 9. Three independent tumor samples were taken from each group, and three independent visual fields were taken from each tumor sample. (K, L) Western blot analysis of USP28 and TCF7L2 in CDX from HepG2 (K) and HuH6 (L) cells treated with vehicle or AZ1. Two‐tailed Student's t‐tests were applied to examine statistical significance. **p < 0.01; ***p < 0.001; ****p < 0.0001
