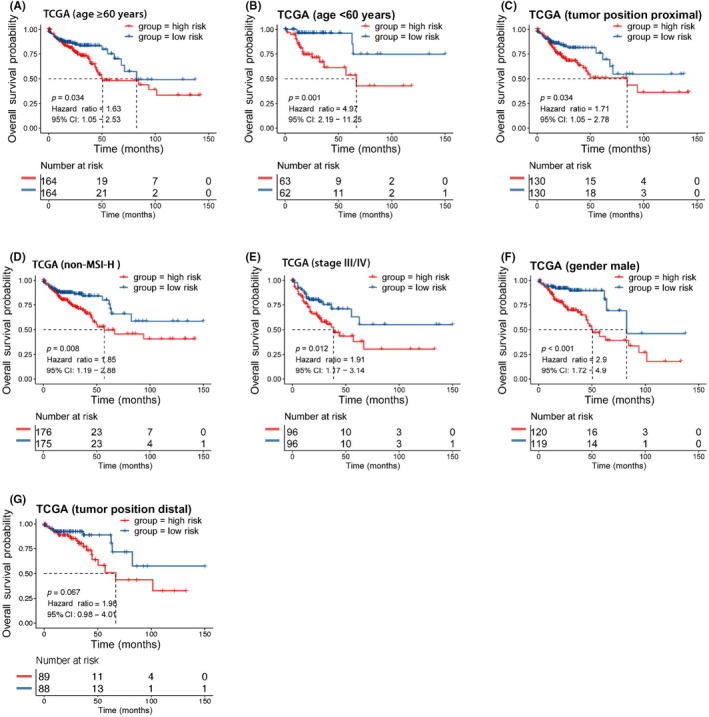
FIGURE 3.

Clinical prognosis prediction of the risk model stratified by different clinical factors in The Cancer Genome Atlas (TCGA) cohort of colon cancer patients. (A) Kaplan–Meier analysis of overall survival (OS) based on the risk model in patients with age ≥60 in the TCGA cohort. (B) Kaplan–Meier analysis of OS based on the risk model in patients with age <60 years in the TCGA cohort. (C) Kaplan–Meier analysis of OS based on the risk model in patients with proximal tumor position in the TCGA cohort. (D) Kaplan–Meier analysis of OS based on the risk model in patients with non‐microsatellite instability‐high (MSI‐H) in the TCGA cohort. (E) Kaplan–Meier analysis of OS based on the risk model in patients with stage III/IV disease in the TCGA cohort. (F) Kaplan–Meier analysis of OS based on the risk model in male patients in the TCGA cohort. (G) Kaplan–Meier analysis of the OS time based on the risk model in patients with distal tumor position in the TCGA cohort. CI, confidence interval
