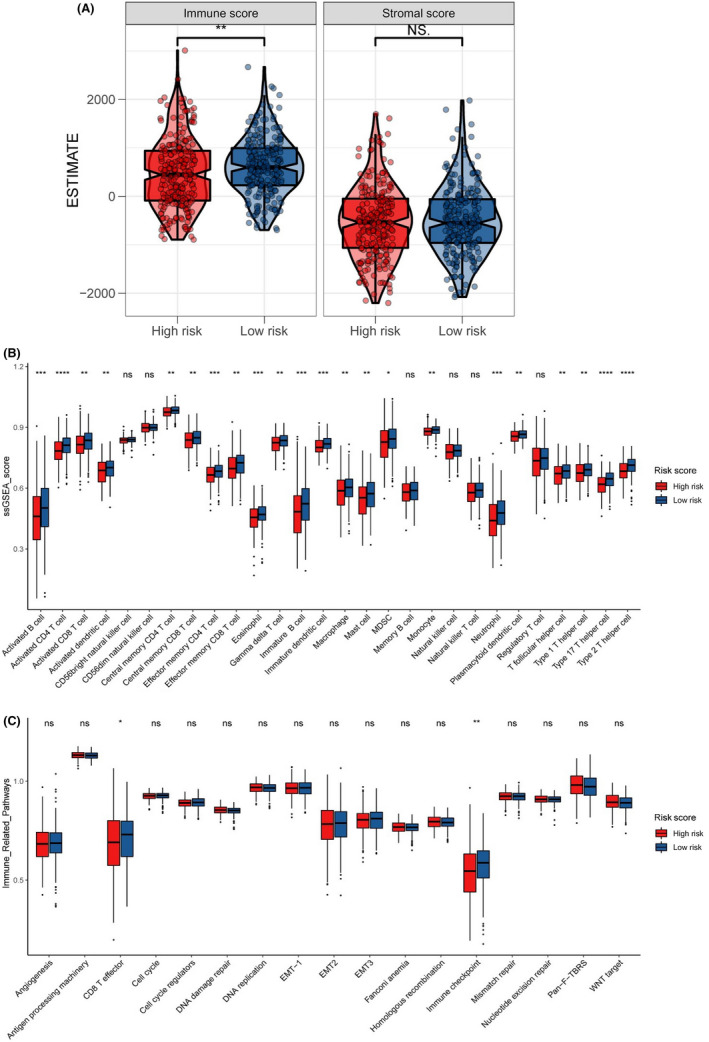
FIGURE 5.

Tumor microenvironment analysis of the prognostic risk model for colon cancer. (A) Immune score and stromal score analyses in low‐risk and high‐risk groups. (B) Level of tumor‐infiltrating immune cells in the two groups, including 28 kinds of different types of immune cells. (C) Tumor microenvironment‐related signature analysis between low‐risk and high‐risk groups. *p < 0.05, **p < 0.01, ***p < 0.001, ****p < 0.0001. ns, not significant; ssGSEA, single‐sample Gene Set Enrichment Analysis
