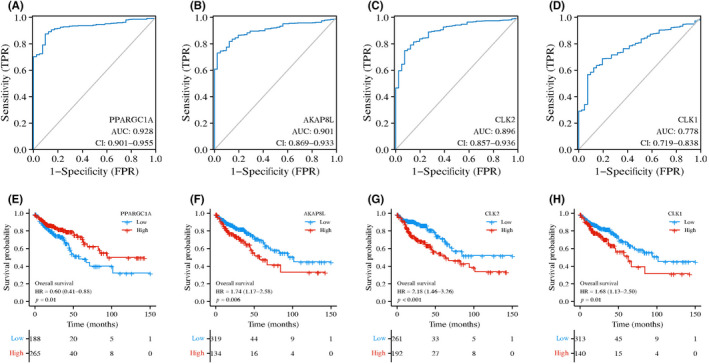
FIGURE 6.

Receiver operating characteristic (ROC) curves and Kaplan–Meier survival curves of overall survival (OS) time of colon cancer patients and four genes. (A–D) ROC analysis of the four key RNA splicing regulator related genes in discrimination of normal and colon cancer patients, all with an area under the ROC curve (AUC) value of >0.75. (E–H) Kaplan–Meier survival curves of OS time for colon cancer patients with high and low expression of indicated RNA splicing‐related genes in The Cancer Genome Atlas dataset. CI, confidence interval; FPR, false positive rate; HR, hazard ratio; TPR, true positive rate
