
FIGURE 4.
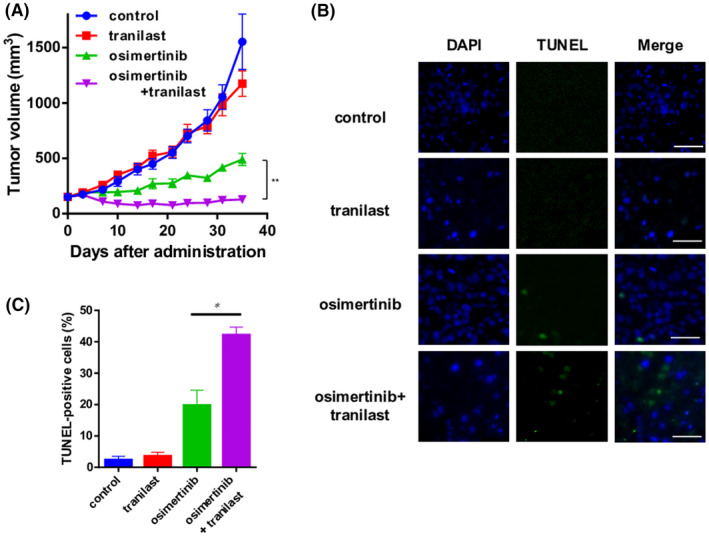
Enhancement of the tumor‐inhibitory effect of tranilast in a mouse xenograft model of non–small cell lung cancer (NSCLC) cells plus cancer‐associated fibroblasts (CAFs). A, A mixture of PC9 cells and CAFs was subcutaneously implanted into the flanks of nude mice. The mice were treated with tranilast (200 mg/kg) alone, osimertinib (5 mg/kg) alone, or a combination of osimertinib plus tranilast by oral gavage five times a week. The tumor volumes were determined on the indicated days after the start of the treatments. Each group consisted of seven mice. Data shown are the means ± SE; **p < 0.01. B, TUNEL staining (green) and DAPI (blue) staining showing the apoptotic neuronal nuclei and all the cell nuclei under microscopy. Scale bars: 50 μm. C, The population of TUNEL‐positive cells is shown as a percentage of the total number of cells. Data represent the means ± SE of five random fields. *p < 0.05. DAPI, 4′,6‐diamidino‐2‐phenylindole; TUNEL, TdT‐mediated dUTP nick end labeling