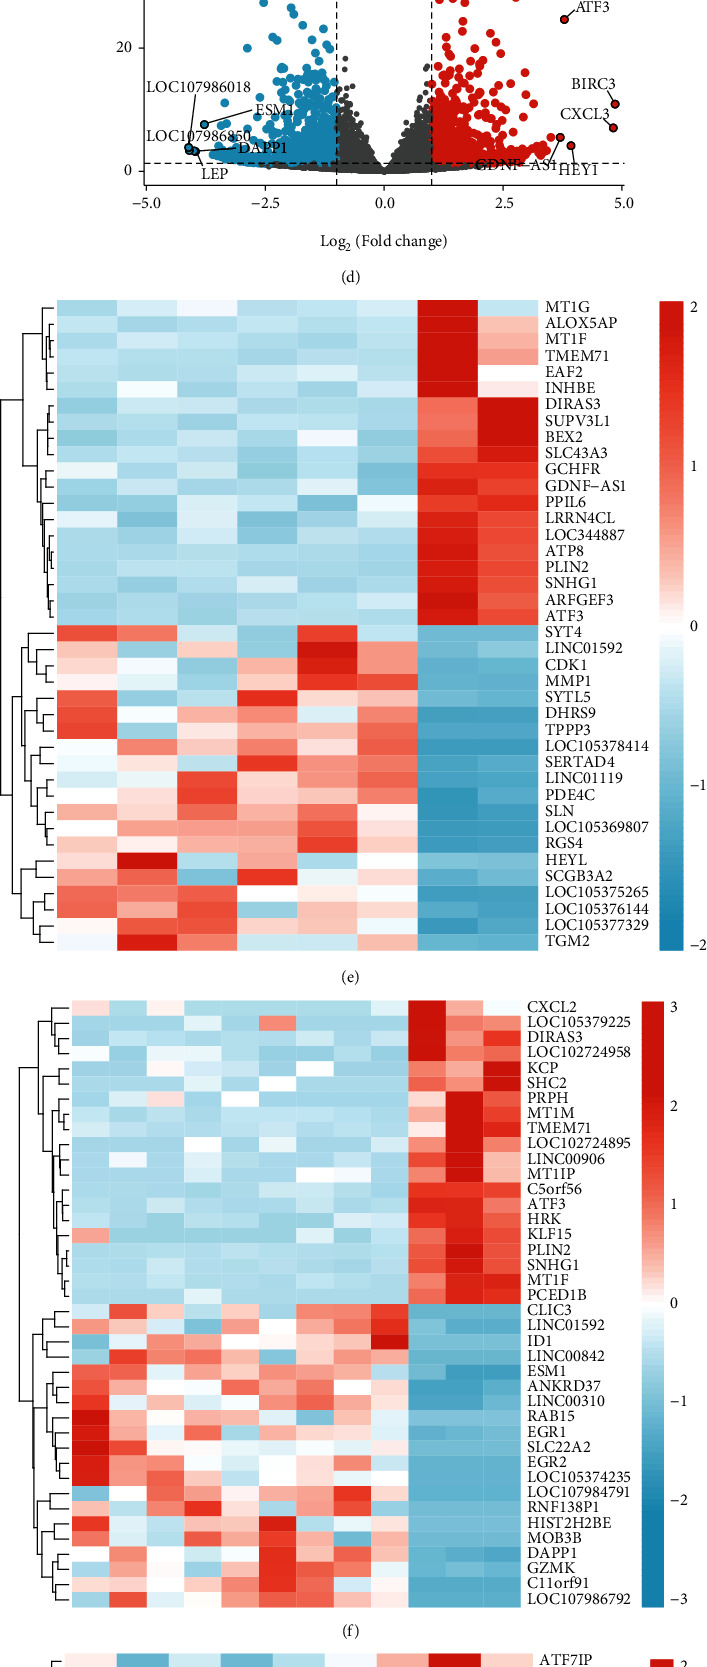
Figure 2.

Verification of differentially expressed genes (DEGs) of anticancer drug regorafenib. (a) Volcano plot for DEGs in A line. (b) Volcano plot for DEGs in B line. (c) Volcano plot DEGs in D line. (d) Volcano plot for DEGs in E line. (e) Heat map for DEGs in A line. (f) Heat map for DEGs in B line. (g) Heat map for DEGs in D line. (h) Heat map for DEGs in E line. DEGs in control groups and treatment groups were defined by the cutoff value (|log₂FC| > 1 and P.adj < 0.05), upregulated genes were in red, and downregulated genes were in blue. (i) Venn plot of upregulated and downregulated differential genes in A, B, D, and E lines. (j) Venn plot of upregulated differential genes in A, B, D, and E lines. (k) Venn plot of downregulated differential genes in A, B, D, and E lines.
