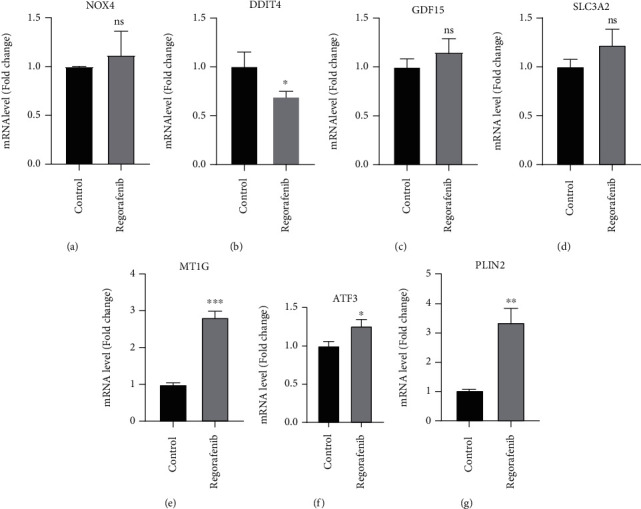
Figure 6.

Relative gene expression verification of seven expressed ferroptosis-related genes. The expression of NOX4 (a), DDIT4 (b), GDF15 (c), SLC3A2 (d), MT1G (e), ATF3 (f), and PLIN2 (g) was measured by real time-qPCR. ∗P < 0.05; ∗∗P < 0.01, ∗∗∗P < 0.001 vs. control group by Student's t-test.
