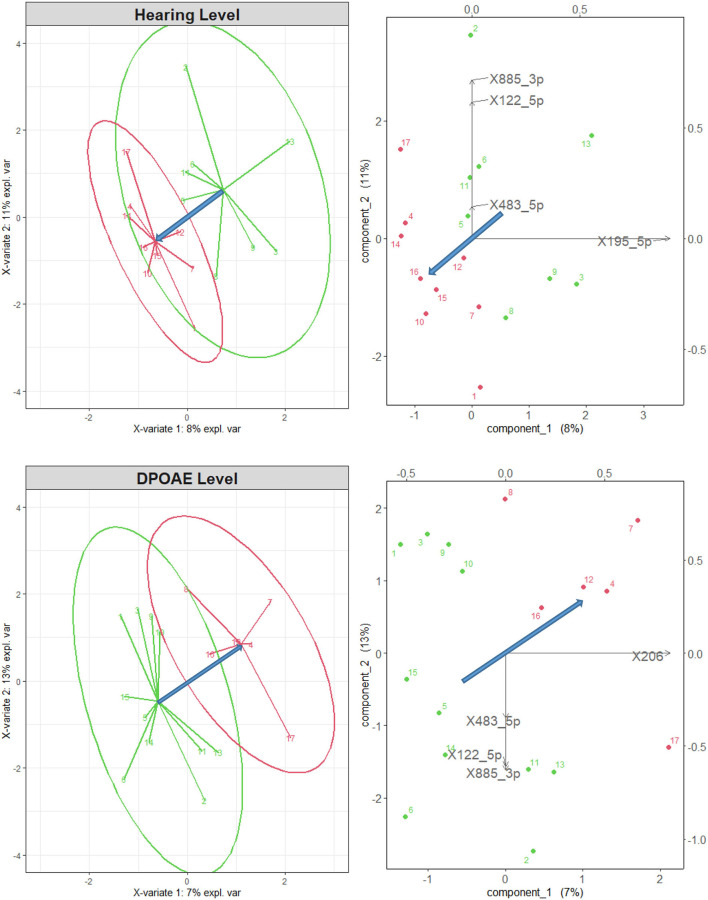
Figure 2.
Left: sPLS-DA for normal-hearing subjects (green points and arrows) and impaired subjects (red), sorted according to their mean audiometric hearing (top) and DPOAE (bottom) level, considering all 56 differentially expressed microRNAs. The two groups are well separated. Right: biplot representation of the original variables in the 2d space of the transformed variables. Only the microRNAs with a correlation higher than 0.75 are shown by the black arrows. The blue arrows represent the direction of maximal discrimination between the two groups.

