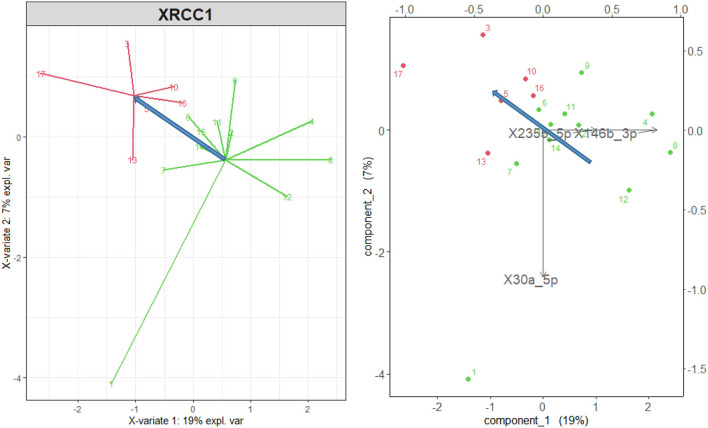
Figure 4.
sPLS-DA wt and mut variants of the gene XRCC1 (green points and arrows) vs. het variant (red). Right: representation of the original variables in the 2d space of the transformed variables. The microRNA with a correlation higher than 0.75 are shown. The blue arrows represent the direction of maximal discrimination between the two groups.

