Figure 3.
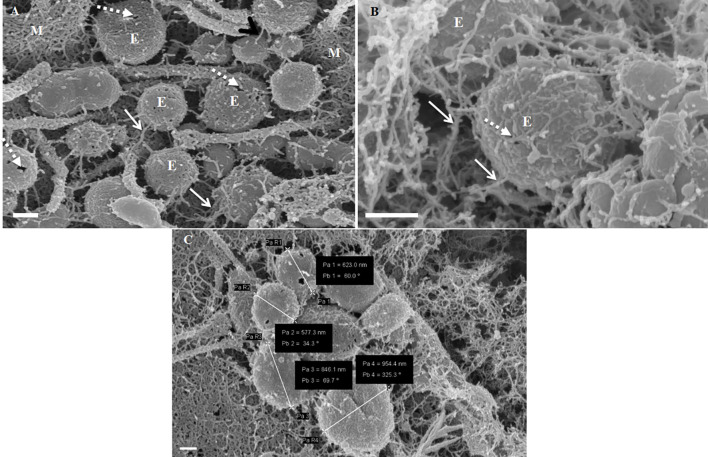
The formation of NTF-exosomes, on the BEC plasma membrane surface. (A) The HR-SEM micrograph depicts exosomes emanating from the bEnd5 plasmalemma. Scale bar = 200 nm. (B) A magnified version of NTF-exosomes accrued on the bEnd5 plasmalemma. The perforated, white arrows indicate the porous NTF-exosome membrane structures. Scale Bar = 300 nm. The “sticky” short filaments of the membrane-bound exosome anchoring to the BEC membrane surface, are indicated by white solid arrows. M denotes the plasmalemma surface, and E denotes Non-TUNT-Forming-exosomes. (C) A heterogenous population of measured, BEC exosomal nanovesicles. Scale bar = 200 nm.

