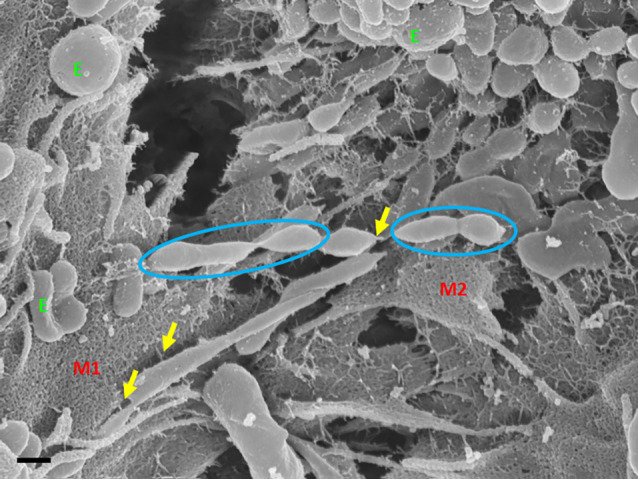
Figure 4.

An HR-SEM microgragh illustrating the interaction of the distal ends of TUNT structures with target cell membranes and the interaction between individual TF-exosomes to form nanotubules. E denotes clustering TF-exosomes on the BEC membrane surface. Yellow arrows indicate interaction points between the TUNT and the BEC membrane and between individual exosomes. M1 denotes the cell membrane on which TUNT originates and M2 denotes the target cell membrane. The blue circles indicate exosome fusion during TUNT formation. Scale bar = 300 nm.
