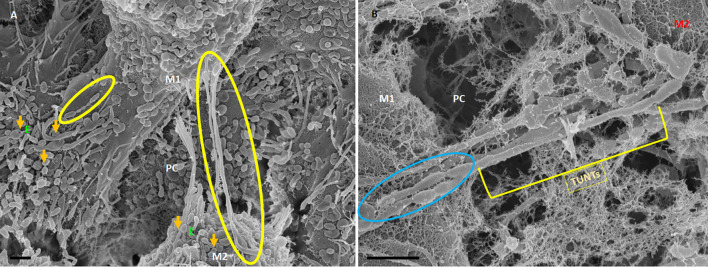
Figure 6.
HR-SEM micrographs depicting bEnd5 exosome expression on a target cell. (A) An HR-SEM micrograph displaying TF-exosome-induced TUNT generation. Scale bar = 1,000 nm on a recipient cell M2. (B) A 200 nm micrograph of the open-ended TUNT formation, scale bar = 1,000 nm. E denotes clusters of exosome accumulation on the BEC membrane, the orange arrows indicate individual exosomes, M1 and M2 denote the porous membranes of the BEC from which NT originates (M1) and the target cell membrane (M2), the yellow circle and TUNT indicate tunneling nanotubes across PC, denotes the paracellular space. Scale bar 1,000 nm.

