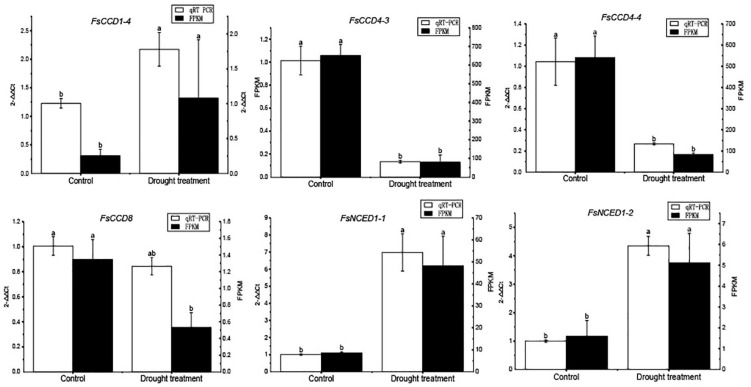
FIGURE 10.
qRT-PCR verification of the CCD genes of Forsythia suspensa under drought stress. Comparison of qRT-PCR (white bar) with RNA-seq data (black bar). The relative changes were calculated with 2–△△Ct. The relative qRT-PCR expression level is shown on the left y-axis. The FPKM from the RNA-Seq data are indicated on the right y-axis. The letters above the bars indicates the significance among different samples.

