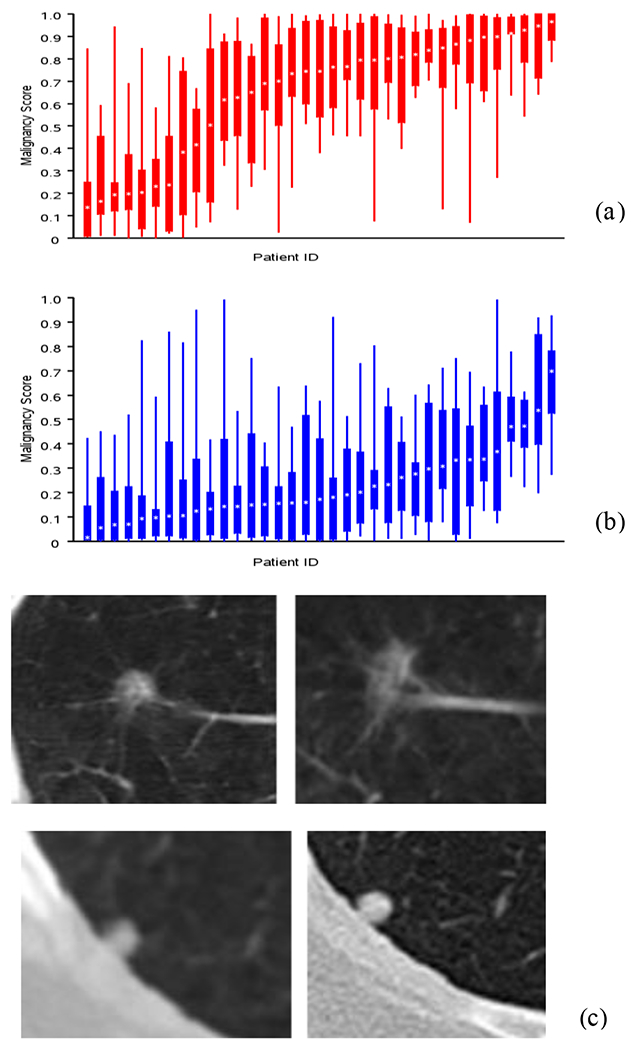
Fig. 3.

Boxplot show distribution of scores for cases and control (x-axis is the patient index, y-axis is the malignancy score) that helps to identify cases where most participants incorrectly reported the diagnostic status, a) Benign (see higher scores), b) Malignant (see lower scores) diagnosis. Representative patient cases showing 2D CT slice across two time points with most teams reporting incorrect malignancy scores. c) Benign diagnosis (average reported score 0.67) and d) Malignant diagnosis. (average reported score 0.26).
