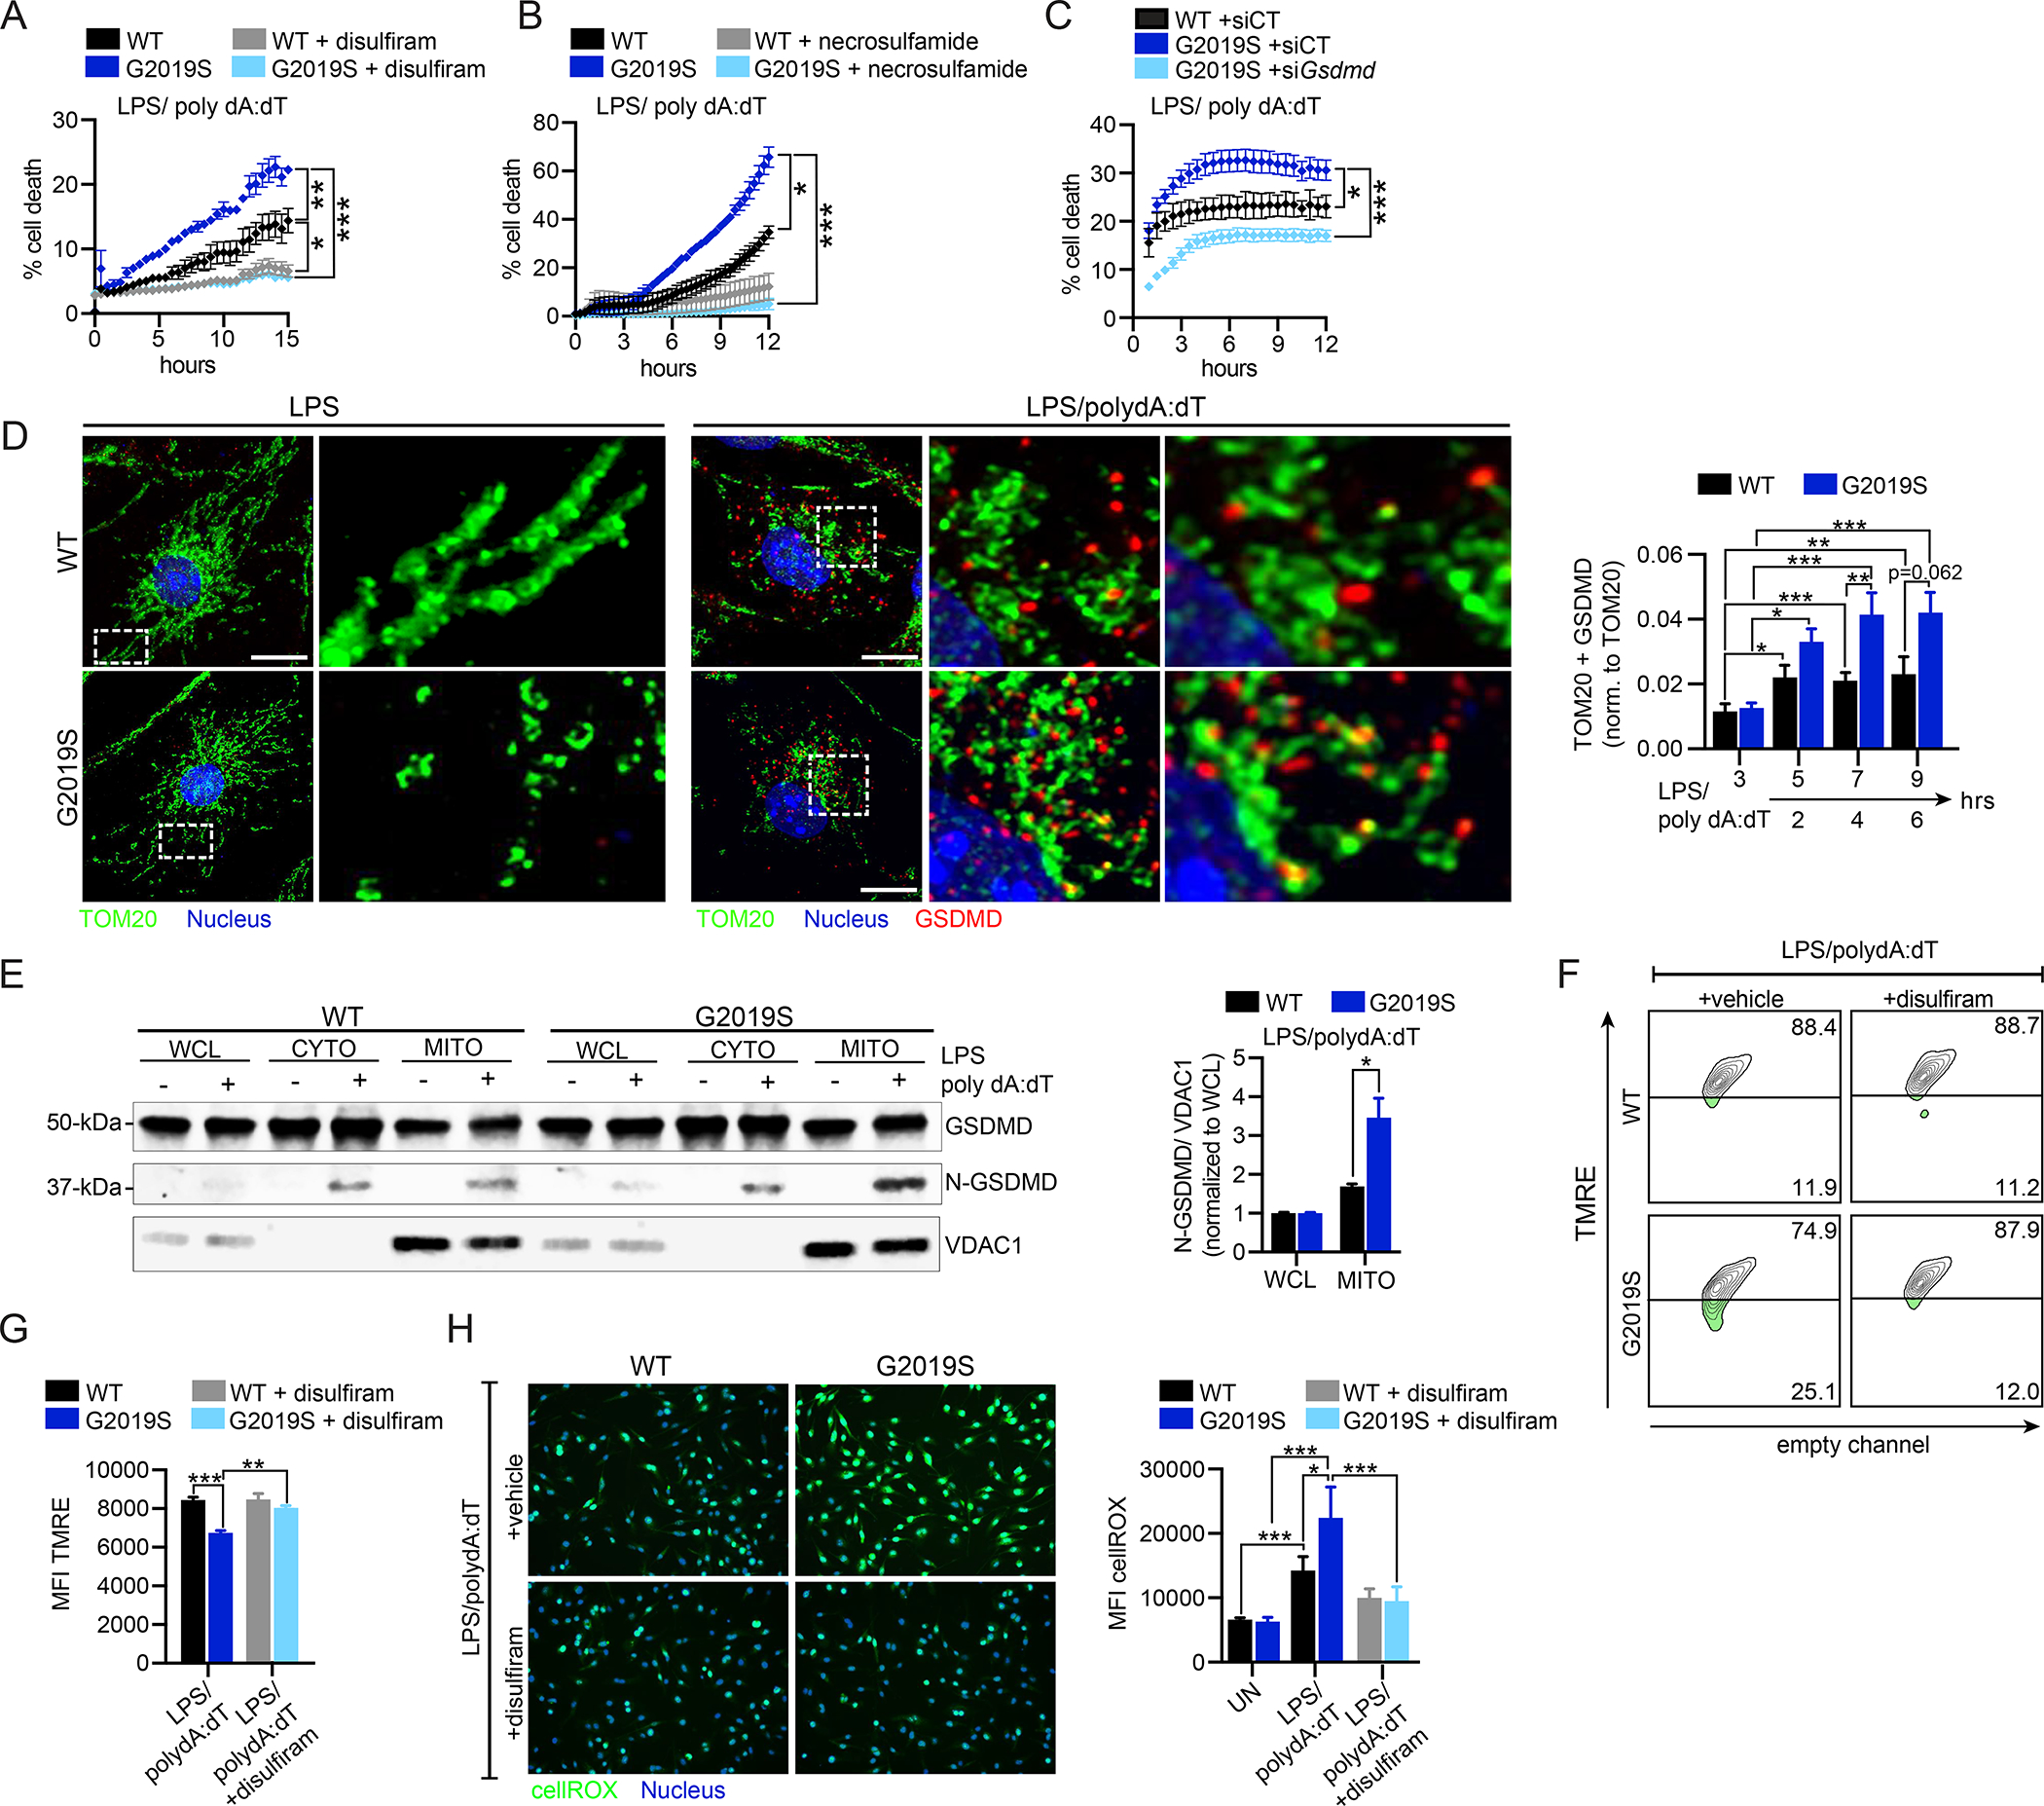
Figure 4. GSDMD mediates mitochondrial dysfunction and cell death during inflammasome activation in Lrrk2G2019S BMDMs.

A. % cell death following AIM2 activation in WT and Lrrk2G2019S BMDMs +/− 1 μM disulfiram added 1h pre-AIM2 activation. B. As in A but with 20 μM necrosulfamide treatment. C. % cell death following AIM2 activation in WT and Lrrk2G2019S BMDMs transfected with siGsdmd or an untargeted negative control siRNA (siCT). D. Mitochondria (anti-TOM20; green) and GSDMD (anti-GSDMD; red) in WT and Lrrk2G2019S BMDMs 3h post-LPS treatment (top) or 4h post-AIM2 activation. Nuclei visualized by DAPI (blue). (right) Fiji-based analysis of TOM20+ GSDMD aggregates normalized to total TOM20 over a time course of AIM2 stimulation in WT and Lrrk2G2019S BMDMs. E. N-GSDMD mitochondrial association in WT and Lrrk2G2019S BMDMs via biochemical fractionation and immunoblot, with VDAC1 to control for mitochondrial membrane enrichment. (right) N-GSDMD relative to VDAC1 normalized to whole cell lysate. n= 2. F. TMRE staining of WT and Lrrk2G2019S BMDMs +1 μM disulfiram or DMSO (vehicle), followed by 2h AIM2 activation, by flow cytometry. G. as in F but TMRE MFI. H. CellROX (green) staining in WT and Lrrk2G2019S BMDMs +1 μM disulfiram or DMSO (vehicle) at 2h post-AIM2 stimulation (live cell nuclei staining with NucBlue). (right) cellROX MFI. Statistical analysis: n=3 or more unless otherwise noted. Statistical significance determined via a two-tailed Student’s T test (F), a two-way ANOVA with Tukey’s post-test (A-C), or a one-way ANOVA with Sidak’s post-test (E, H, J).
