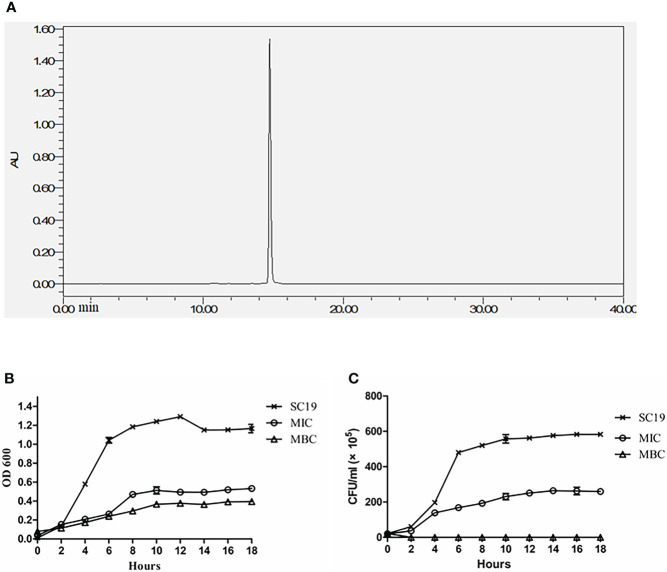
Figure 1.
EGCG extract quantification and effect of EGCG on SC19 growth (A) The EGCG extract was quantitatively determined by HPLC, The purity of EGCG reached 99.99%. (B) Kinetics of the killing effect of EGCG on SC19. The concentrations of EGCG ranged from MIC to MBC. Bacterial viability were monitored by CFU counts at the indicated times. (C) OD 600 of SC19 in the absence of EGCG and in the presence of EGCG at MIC and MBC.

