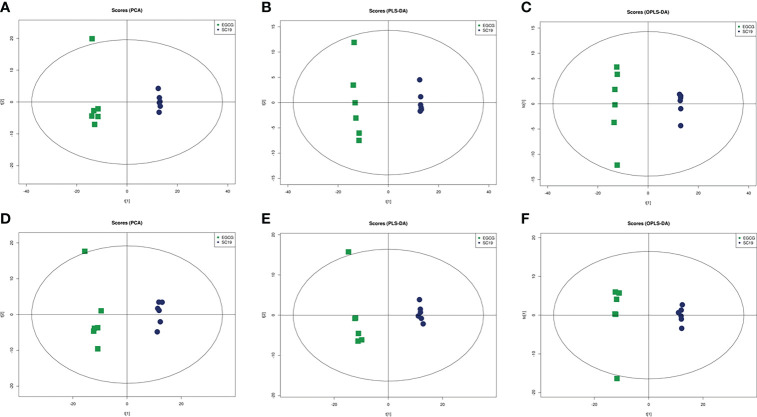
Figure 4.
Differentiation of the metabolic profiles of the SC19 vs EGCG treated SC19 using multivariate analysis. PCA analysis of metabolites under positive (A) and negative (D) ion modes. PLS-DA analysis of metabolites under positive (B) and negative (E) ion modes. OPLS-DA analysis of metabolites under positive (C) and negative (F) ion modes. Spots in blue show samples from the SC19 group, spots in green indicate samples from the EGCG treated SC19 group, there are six replicates per group.

