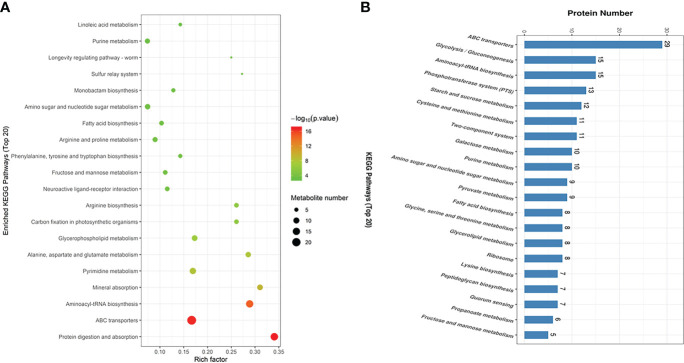
Figure 5.
The enriched KEGG pathways of the DMs and DEPs in SC19 compared to EGCG treated SC19. (A) Enrichment analysis of the differential metabolites. Rich factor represents the ratio of the number of DMs to total metabolites in each pathway. (B) Enrichment analysis of the differently expressed proteins. The top 20 KEGG pathways were shown on the graph.

