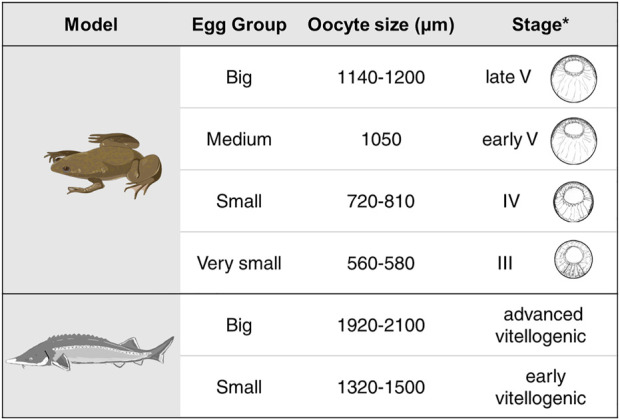
FIGURE 2.

Summary of the different oocyte sizes assessed for each of the models. Shown for the X. laevis model are the schematic drawings for the equivalent stages for the given oocyte as derived from *Carotenuto and Tussellino (2018). Stage classification of the X. laevis oocytes are from Dumont (1972).
