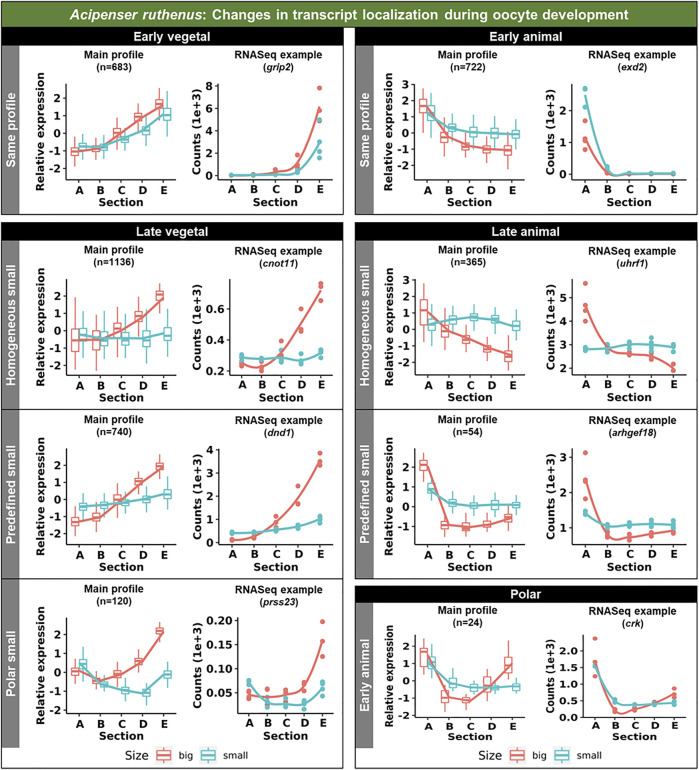
FIGURE 5.
Unique groups representing the significant sub-cellular transcript alterations between the different oocyte sizes of the Acipenser ruthenus. Five groups of localization profiles were observable, early vegetal, late vegetal, early animal, late animal and polar. The following subgroups were observed: same profile - similar profile in early and late stages; predefined small - profile already established in the early stage; homogeneous small - profile is ubiquitous in the small stage; polar small—profile shows maximum expression in the polar regions of the oocyte; early animal—profile shows animal distribution in the early stage. The sections correspond to the regions of the oocyte that were cryosectioned, whereby sections A - extremely animal, B - animal, C - central, D - vegetal, E - extremely vegetal.

