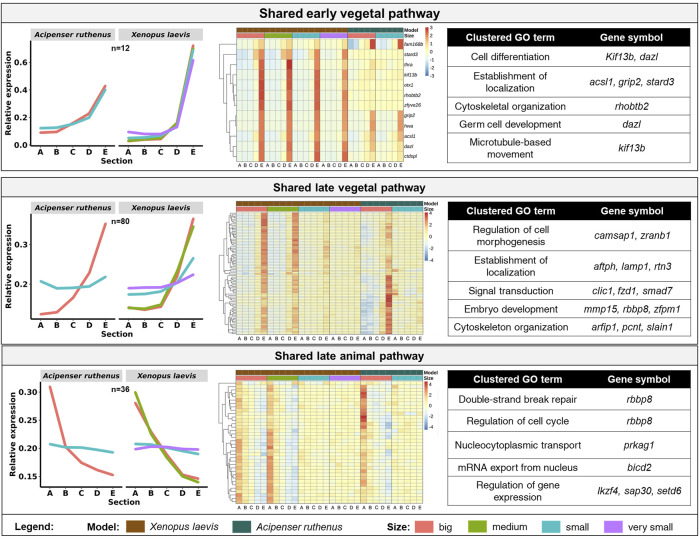
FIGURE 7.
Vegetal and animal transcripts with similar temporal sub-cellular profiles in Xenopus laevis and Acipenser ruthenus. Heatmap is based on the Z-score of the transcript expression relative to the oocyte stage of the model. The Gene Ontology terms are those found associated with the given group of transcripts. Transcripts were filtered to include only those with either limited (early vegetal < ∼1.5x) or enhanced (late pathways > ∼1.2x) fold differences between stage sections of interest. The sections correspond to the regions of the oocyte that were cryosectioned, whereby sections A - extremely animal, B - animal, C - central, D - vegetal, E - extremely vegetal.

