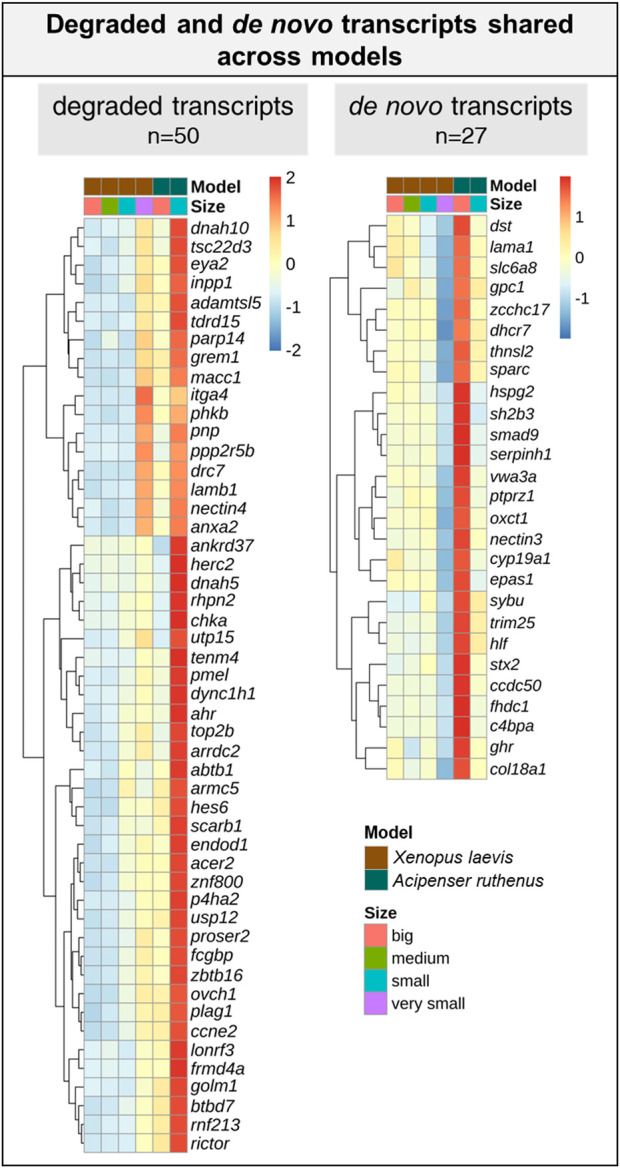
FIGURE 8.

List of transcripts with a reduced or over abundance during the oocyte development between the Xenopus laevis and Acipenser ruthenus. Heatmap is based on the Z-score of the percentage mean transcript expression relative to each model. Representative transcripts show a minimum of ∼1.5x change relative to a given oocyte stage.
