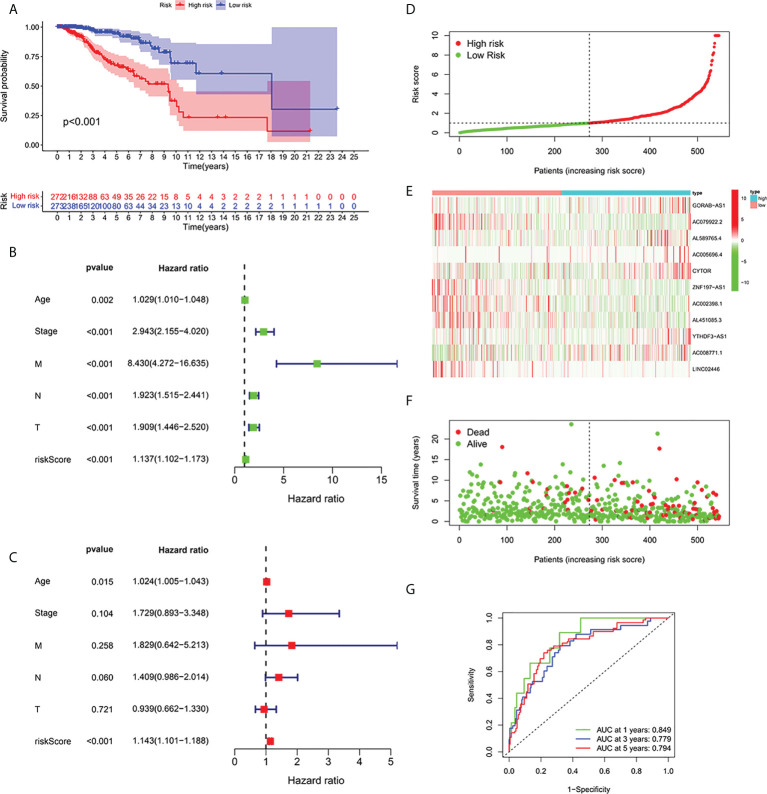
Figure 2.
Relationship between prognosis and predictive features of patients with BC. (A) OS rates for BC patients in the high-risk and low-risk teams according to a Kaplan-Meier analysis. (B) Forest map of univariate Cox regression analysis. (C) Forest map of multivariate Cox regression analysis. (D) Risk score of BRCA patients calculated according to the model and division of high- and low-risk teams. (E) Gene expression heat maps. (F) Survival status. (G) ROC curve of the predictive characteristic and AUC of 1-, 3-, and 5-year survival. OS, overall survival; ROC, receiver operating characteristics; AUC, area under curve; T, tumor; N, lymph nodes; M, Metastasis.

