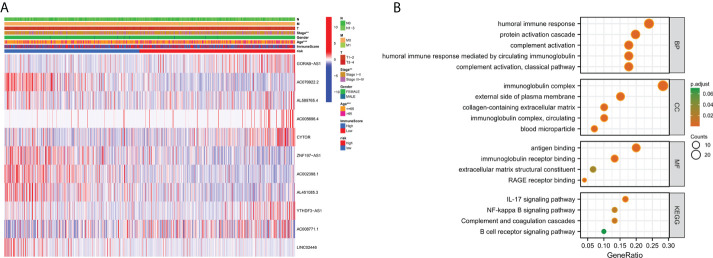
Figure 7.
Clinically relevant heat map and GO/KEGG pathway enrichment analysis. (A) On the basis of risk characteristics associated with prognosis, a heat map of distribution of cuproptosis-related lncRNA and clinical pathology variables was plotted. The more intense the red, the more intense the expression. The more intense the blue, the more subdued the expression. **p < 0.01, ***p < 0.001. (B) The graph depicts the GO and KEGG analysis of differential genes with high and low risk..

