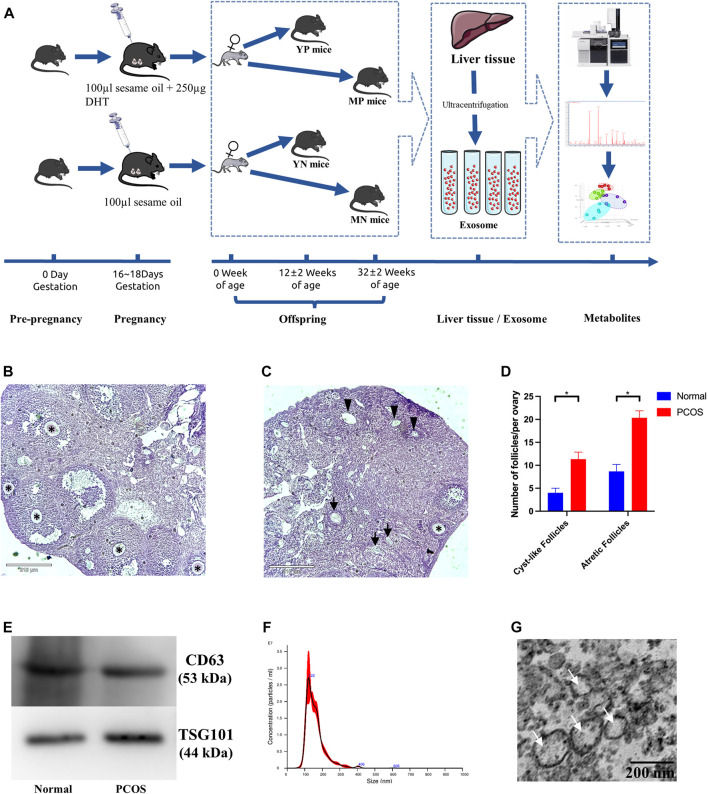
FIGURE 1.
(A) Overview of PCOS modeling process. Morphological appearance and evaluation of follicles in affected ovaries from (B) normal (left) and (C) PCOS mice. The normal follicles were indicated with black asterisks (*), the atretic follicles were indicated with black arrows (↑), and the cystic follicles were indicated with black triangles (▲). (D) Bar graphs show the number of atretic follicles and cystic follicles in PCOS and normal mice (*Student’s t-test, p <0.05). (E) Western blotting validated exosomes through CD63 and TSG101. (F) The size distribution of exosomes measured by the method of NTA. (G) Exosomes examined by Transmission electron microscopy (TEM).

